Scoring Goals in the Business League
The 6 Universal Key Performance Areas and the KPIs that Every Team Needs.

- Grow the business
- Increase efficiency, profitability, and cash flow
- Build sustainability
- Quantifiable - No subjectivity, only data-driven.
- Uncomplicated - Simple to gather the data needed.
- Intuitive (for Practical) - Easy for people to understand in any business and any team.
- Customizable (for Agile) - Ability for the measurement to be adjusted slightly for the specific situation.
- KPIs - Key Performance Indicators.
Who did I write this for?
Although no one is excluded, through my personal experience in the finance industry, I narrowed down the list to positions and sectors that I believe can benefit from this guide:
This guideline is designed for:
- CFOs and CEOs that who need to streamline performance measurement and ensure that KPIs align with business plans and financial forecasts.
- Organizations whose performance management systems have become overly complex and are seeking a return to simplicity.
- Organizations that struggle to correlate bonuses with quantifiable data and end up distributing bonuses subjectively.
- Remuneration committees that rely on a flawed performance management system for their remuneration policies.
- Organizations with subjective, unmeasurable, slow, and manual KPIs.
- Organizations without proper KPIs that needing a starting point.
- Shareholders looking for personal KPIs for their leadership team.
Introduction to the Framework
The most common question we receive at KPI Management Solutions is, "I need KPIs for my business, but where do I start?" To address this, we've developed a framework using a football analogy as part of our workshop preparation.
In a football team, each position has a specific purpose, role, and responsibility.
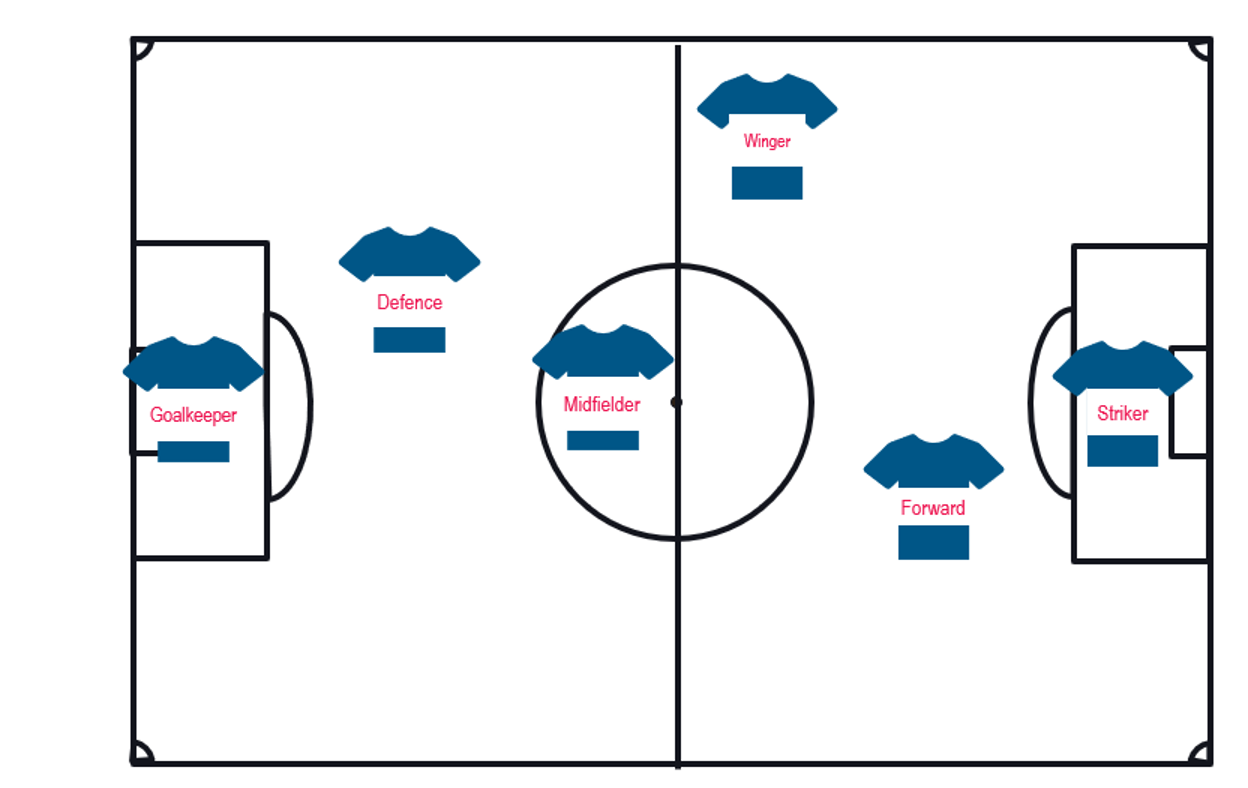
When selecting KPIs for your business, you are much like a football manager choosing positions and players to achieve your goals (no pun intended).
Just as understanding the fundamentals of football can change the outcome of a game, focusing on Key Performance Areas (KPAs) can guide any company toward its objectives. KPAs are groupings of similar KPIs, which can be based on processes, business objectives, or strategic themes. Once you have identified your KPAs, it becomes easier to pinpoint specific KPIs that fall under these categories.
Let's break down the six universal KPAs through a football analogy, highlighting their importance in driving a business to success.
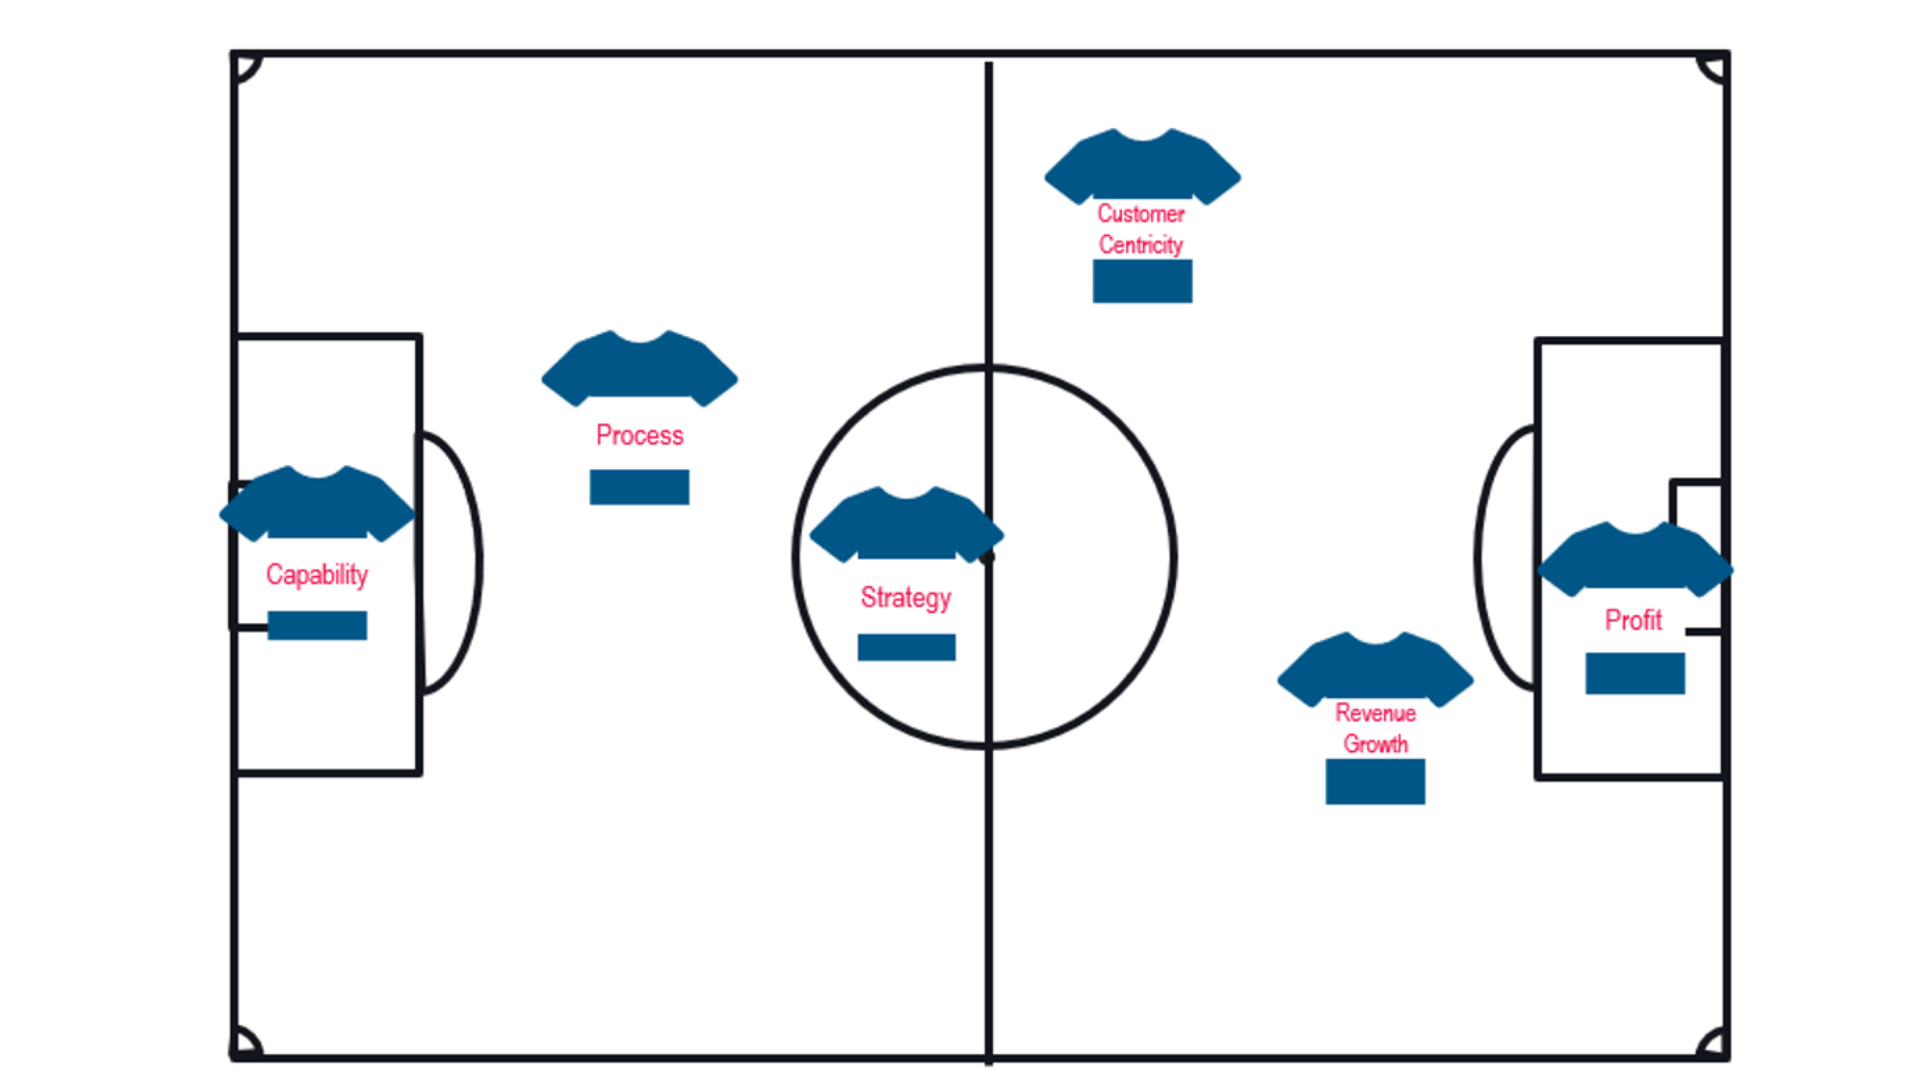
These recommended KPAs highlight the 6 performance areas that every business unit or team need to dribble their way to the top:
- Profit
- Revenue Growth
- Customer Centricity
- Business Strategy
- Process
- Capability
The six KPAs can be cascaded throughout the organization down to an individual level. At least five of them would apply to every individual within the organization, sometimes in a form that is unique to their role.
In the remainder of this document, we will explain each KPA and why it is crucial. Once we understand the purpose of each KPA, we will offer suggestions for selecting one KPI to fit under each KPA.
While there could be millions of variations if you're starting out or trying to streamline your performance system, begin with our suggestions and tweak them to suit your business.
The suggestions are structured into three levels of complexity. Choose only one, depending on how mature your business is, how quickly you want to see results, and how much effort you want to invest in getting the scoreboard ticking:
- Easy KPIs - These are typically simple KPIs where the data is readily available in most organizations.
- Convenient KPIs - These may require a bit more effort and processes to collect the data but shouldn't be too taxing or take long to implement.
- Ideal KPIs - If you have the raw data and the time and skills to enrich it with good business logic, these will provide the best coverage, as they encompass the underlying processes and goals, leading to greater insights and improved performance.
We have also tagged each KPI to address one of the value drivers:
- 🥇 Quality - measures the quality of outputs.
- 📈Quantity - measures the volumes or productivity of outputs.
- ⏰ Time - measures lead times and due dates of deliverables.
- 💰Efficiency - measure the financial or operational efficiencies of deliverables.
It's always risky to have a KPI that only addresses one value driver, as people will focus on that single aspect, potentially neglecting others. In a business, one type of value driver should be balanced with additional drivers to ensure a holistic approach.
Note: This article isn't suggesting that you shouldn't measure anything else. Our goal is to identify six possible KPIs that could be universally applicable.
A KPI is a key indicator that measures progress toward the desired state, reflecting where the business aims to be in the next three to five years.
The 6 Universal KPIs
1. Profit - The Striker
The One Who Scores The Goals
In football, the ultimate aim is scoring goals, with the striker's job being to score the majority of them. A team won't win the championship if it doesn't score goals. If a striker fails to score, the manager will soon need to replace them or try different tactics.
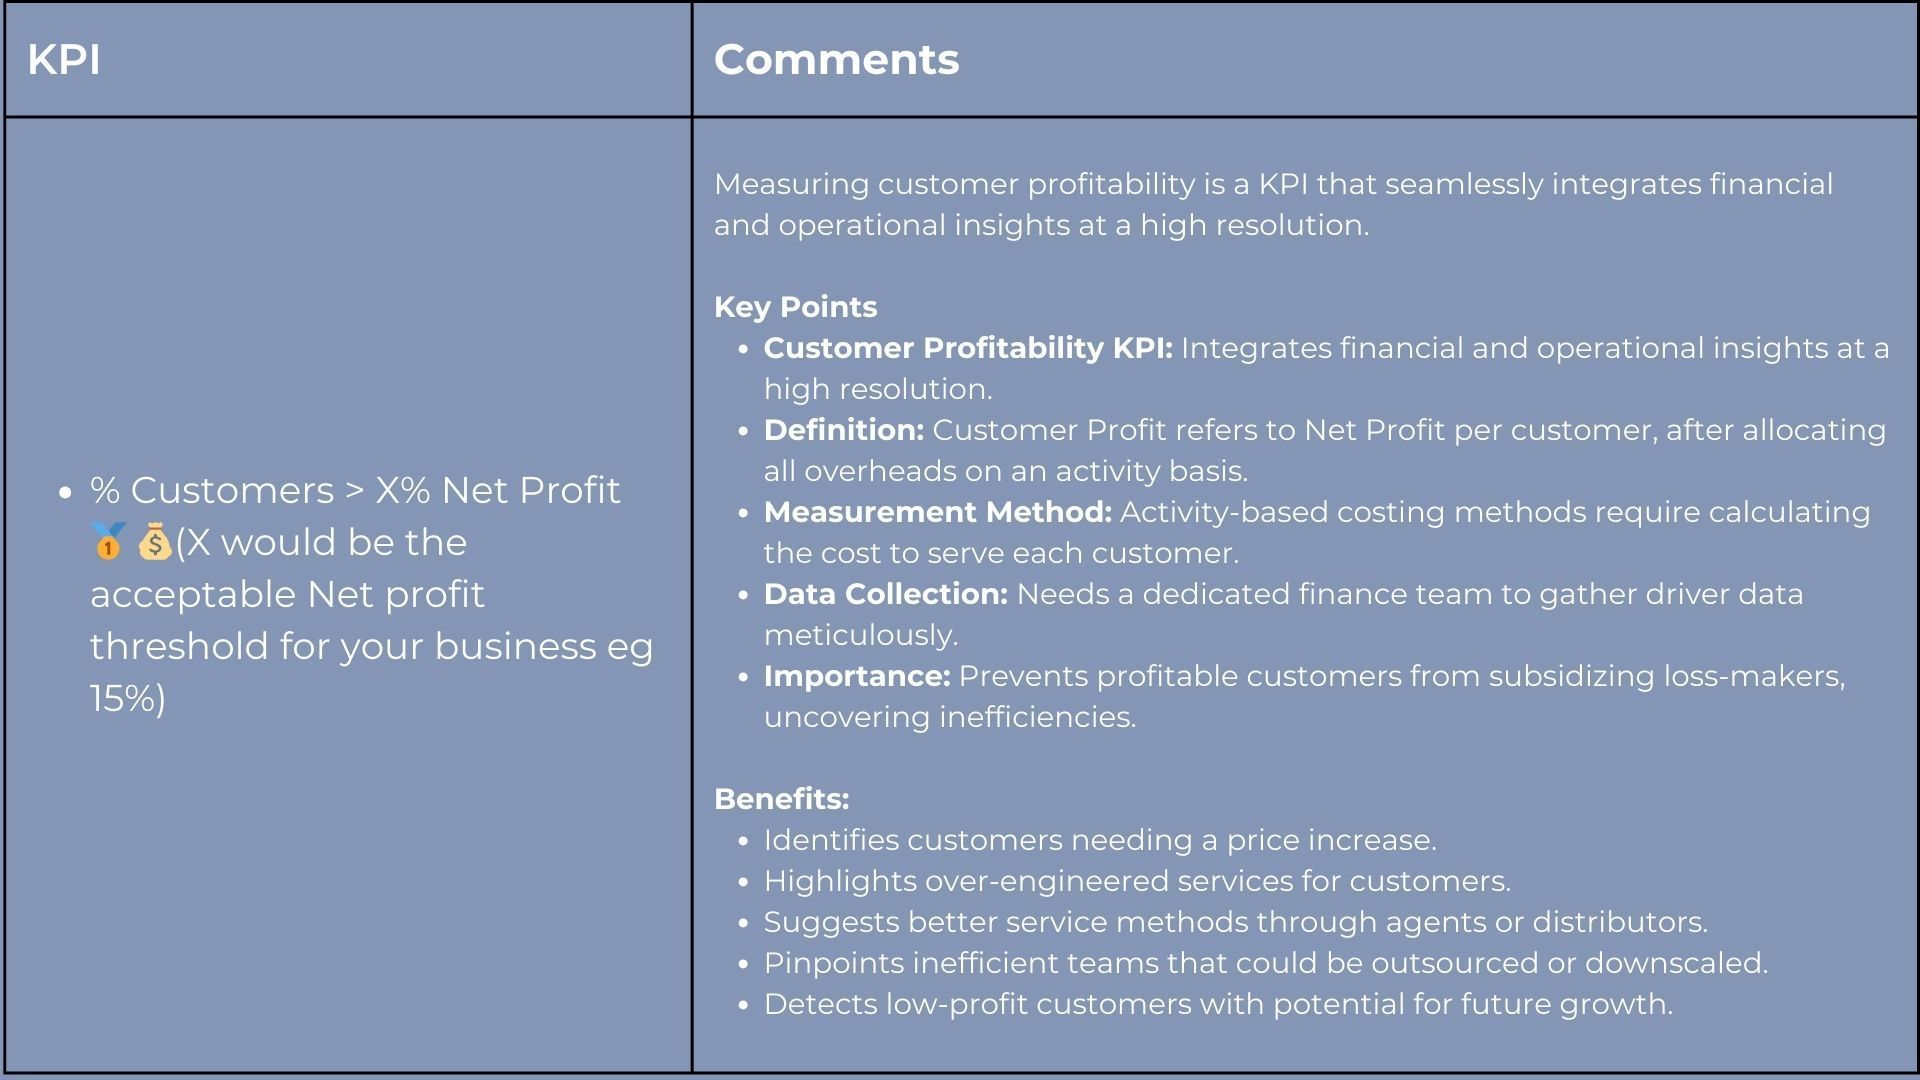
In business, profit is the primary goal of any for-profit organization. It's a straightforward indicator of your business performance. If you’re not making profits, you're not progressing. Profit can increase even when revenue is flat, as businesses can become bloated, and a focus on cost reduction and efficiencies can move the needle, helping the business thrive until revenue growth returns. Without sustainable profit, cash flow will dry up, and shareholders will replace the CEO, CFO, and the rest of the management team if profits decline or don't meet their potential. It's just a matter of time.
Here are some profit KPIs to track against desired targets, which will be defined as part of the reporting process. Specific targets are not included in this article.
Pick A KPI:
Easy
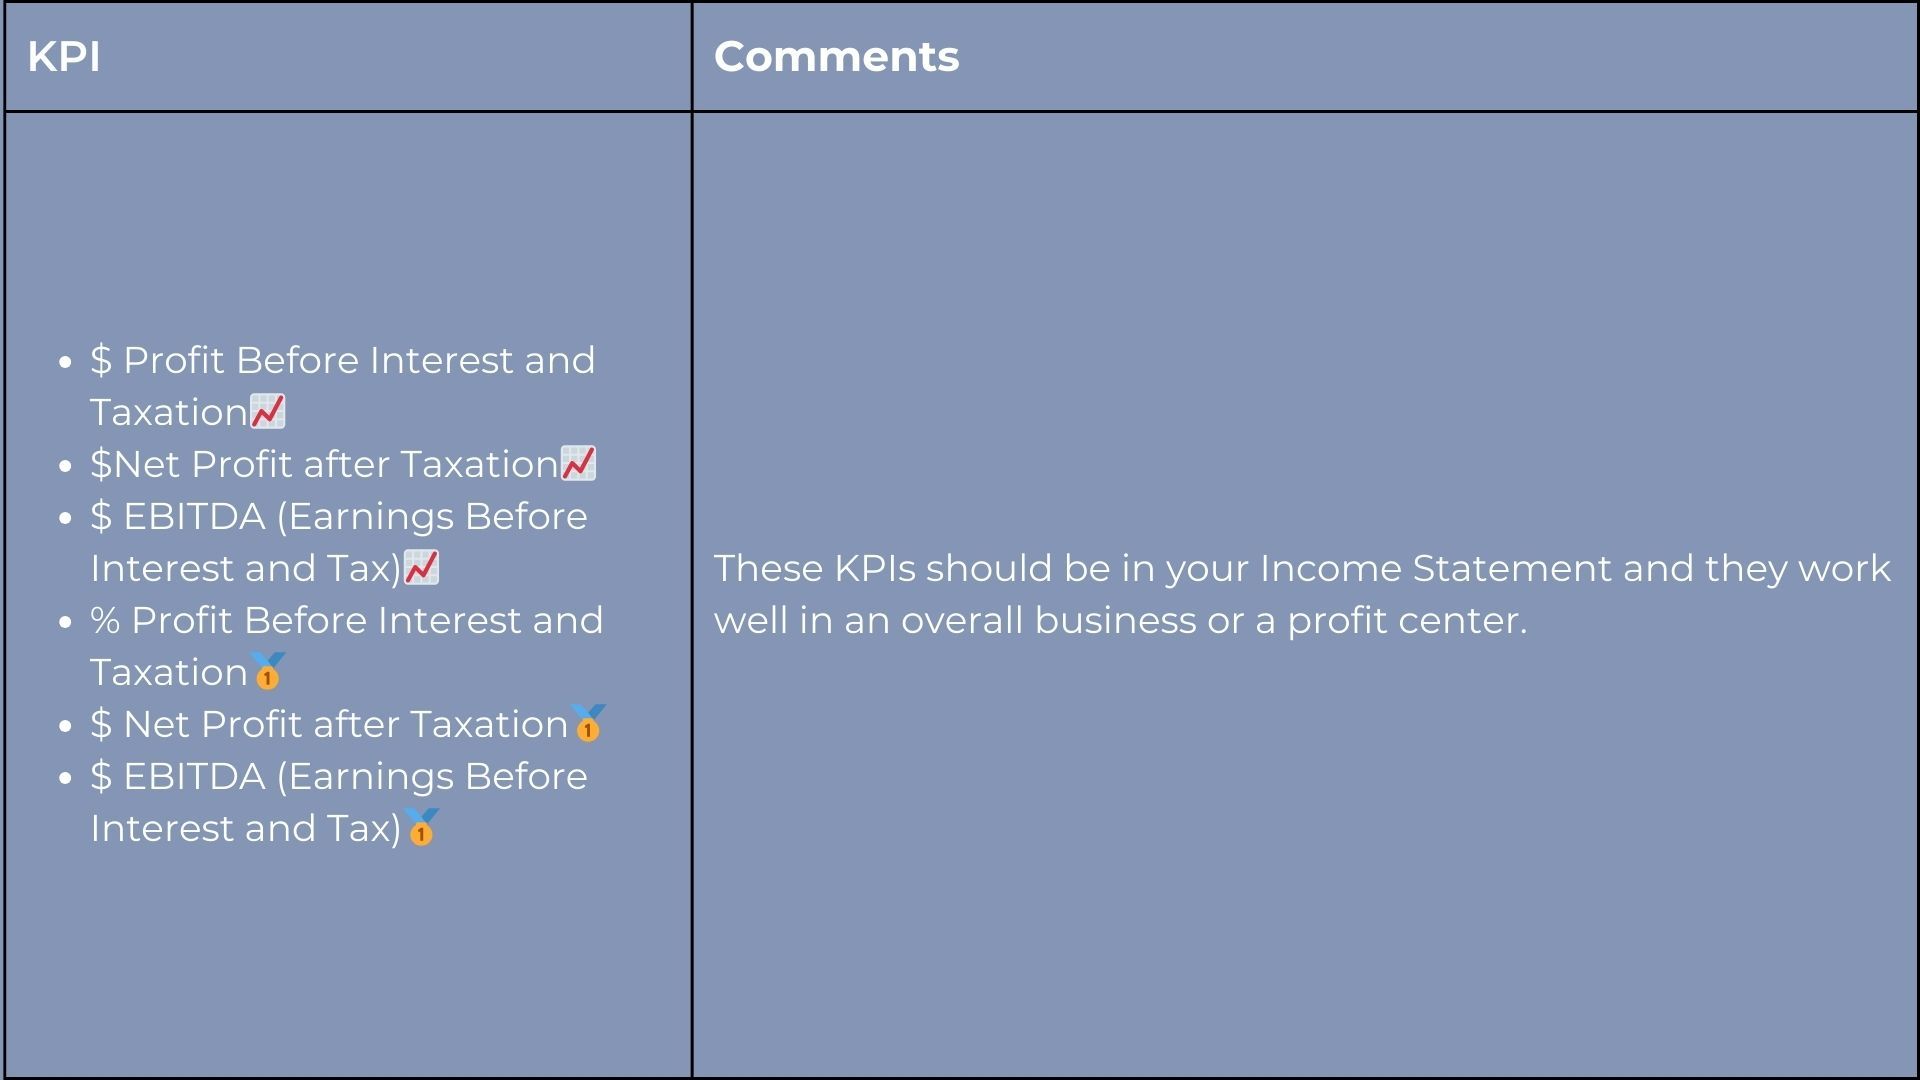
Convenient
Ideal
2. Revenue Growth - The Forward or Goal Assist.
The One Who Sets Up the Goals
Revenue Growth Paves the Way to Profit," says Roger Knocker, CEO of KPI Management Solutions.
In football, the player who sets up the goals is often as esteemed as the player who scores. A well-executed assist can make it easy for the striker to score. Often, the hard work is done by the player providing the assist.
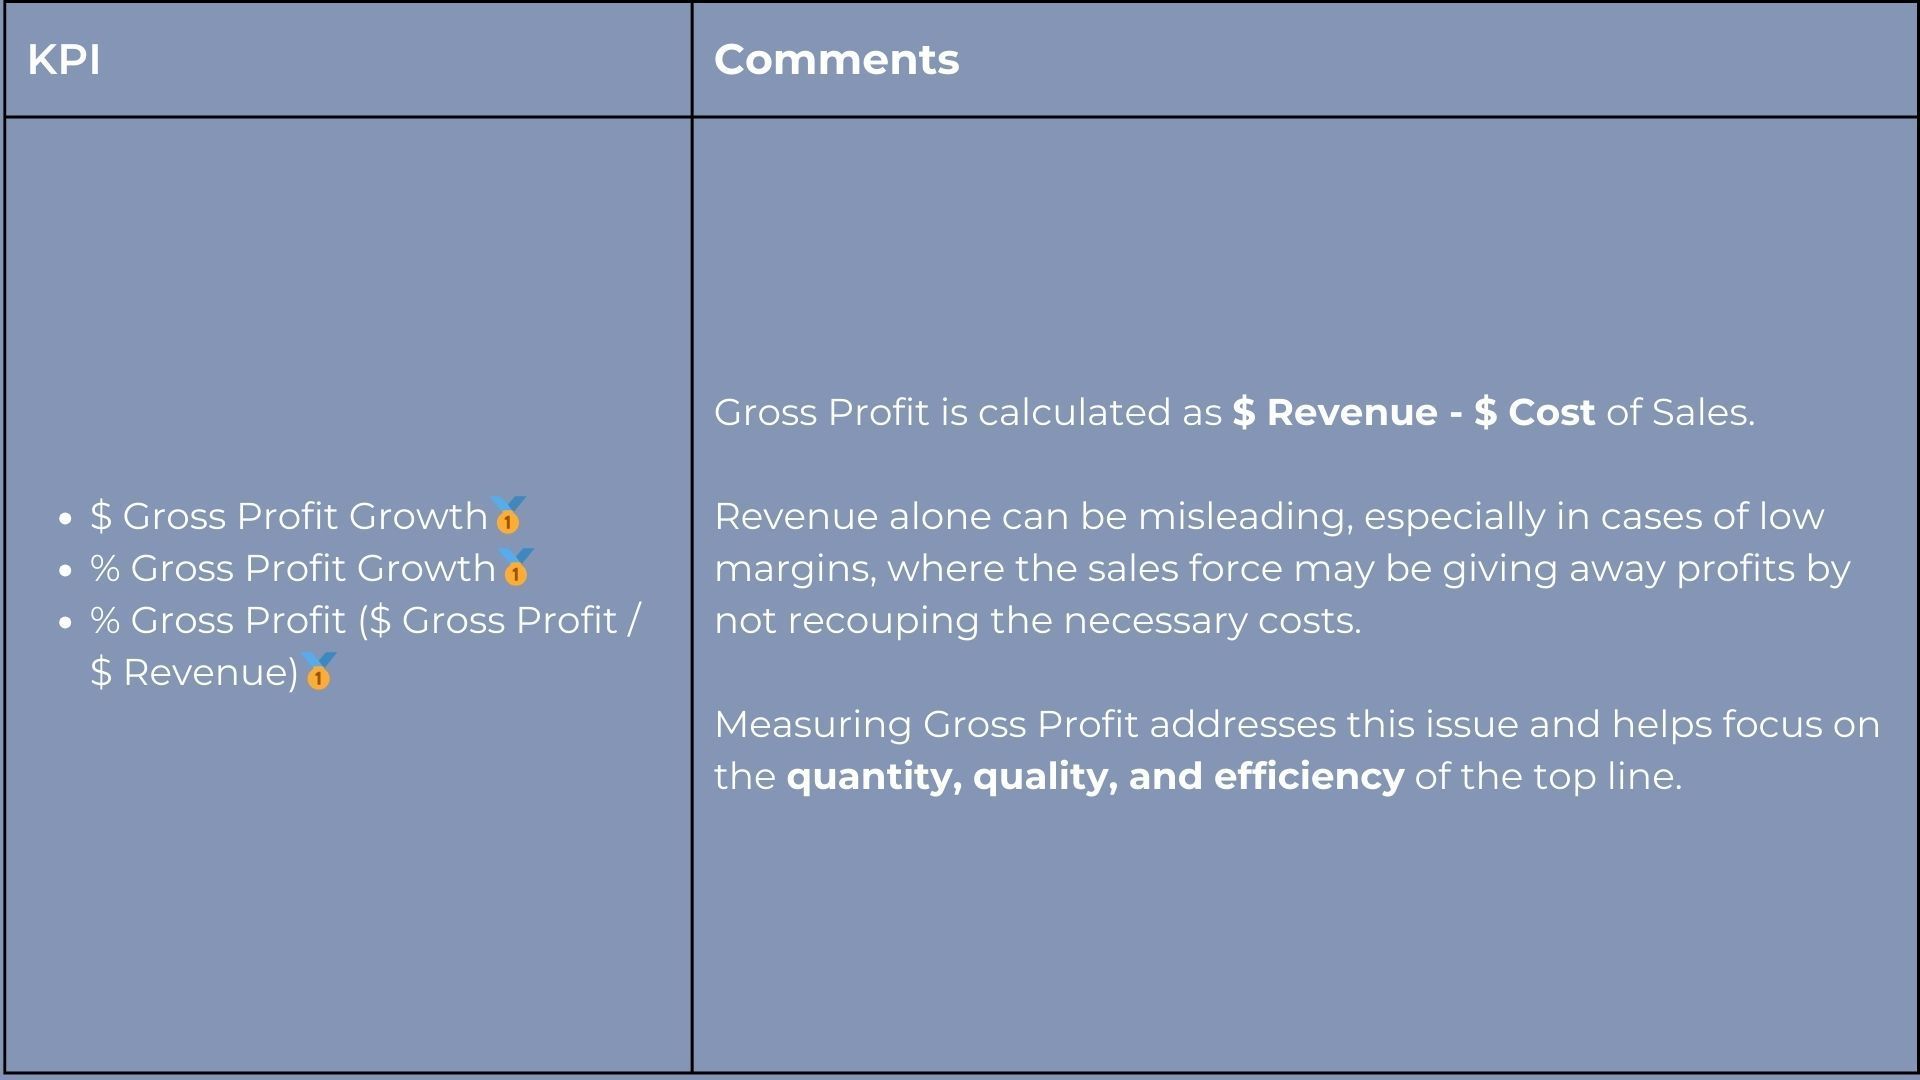
In business, the sales teams and rainmakers are the heroes, and rightly so. However, unless they set up the deals correctly—with proper margins and delivery terms—the strikers will miss the goal every time, resulting in losses to the bottom line. It's crucial to get the top line working effectively. It's not just about volume, the quality of the gross profits is even more critical.
Pick A KPI:
Easy
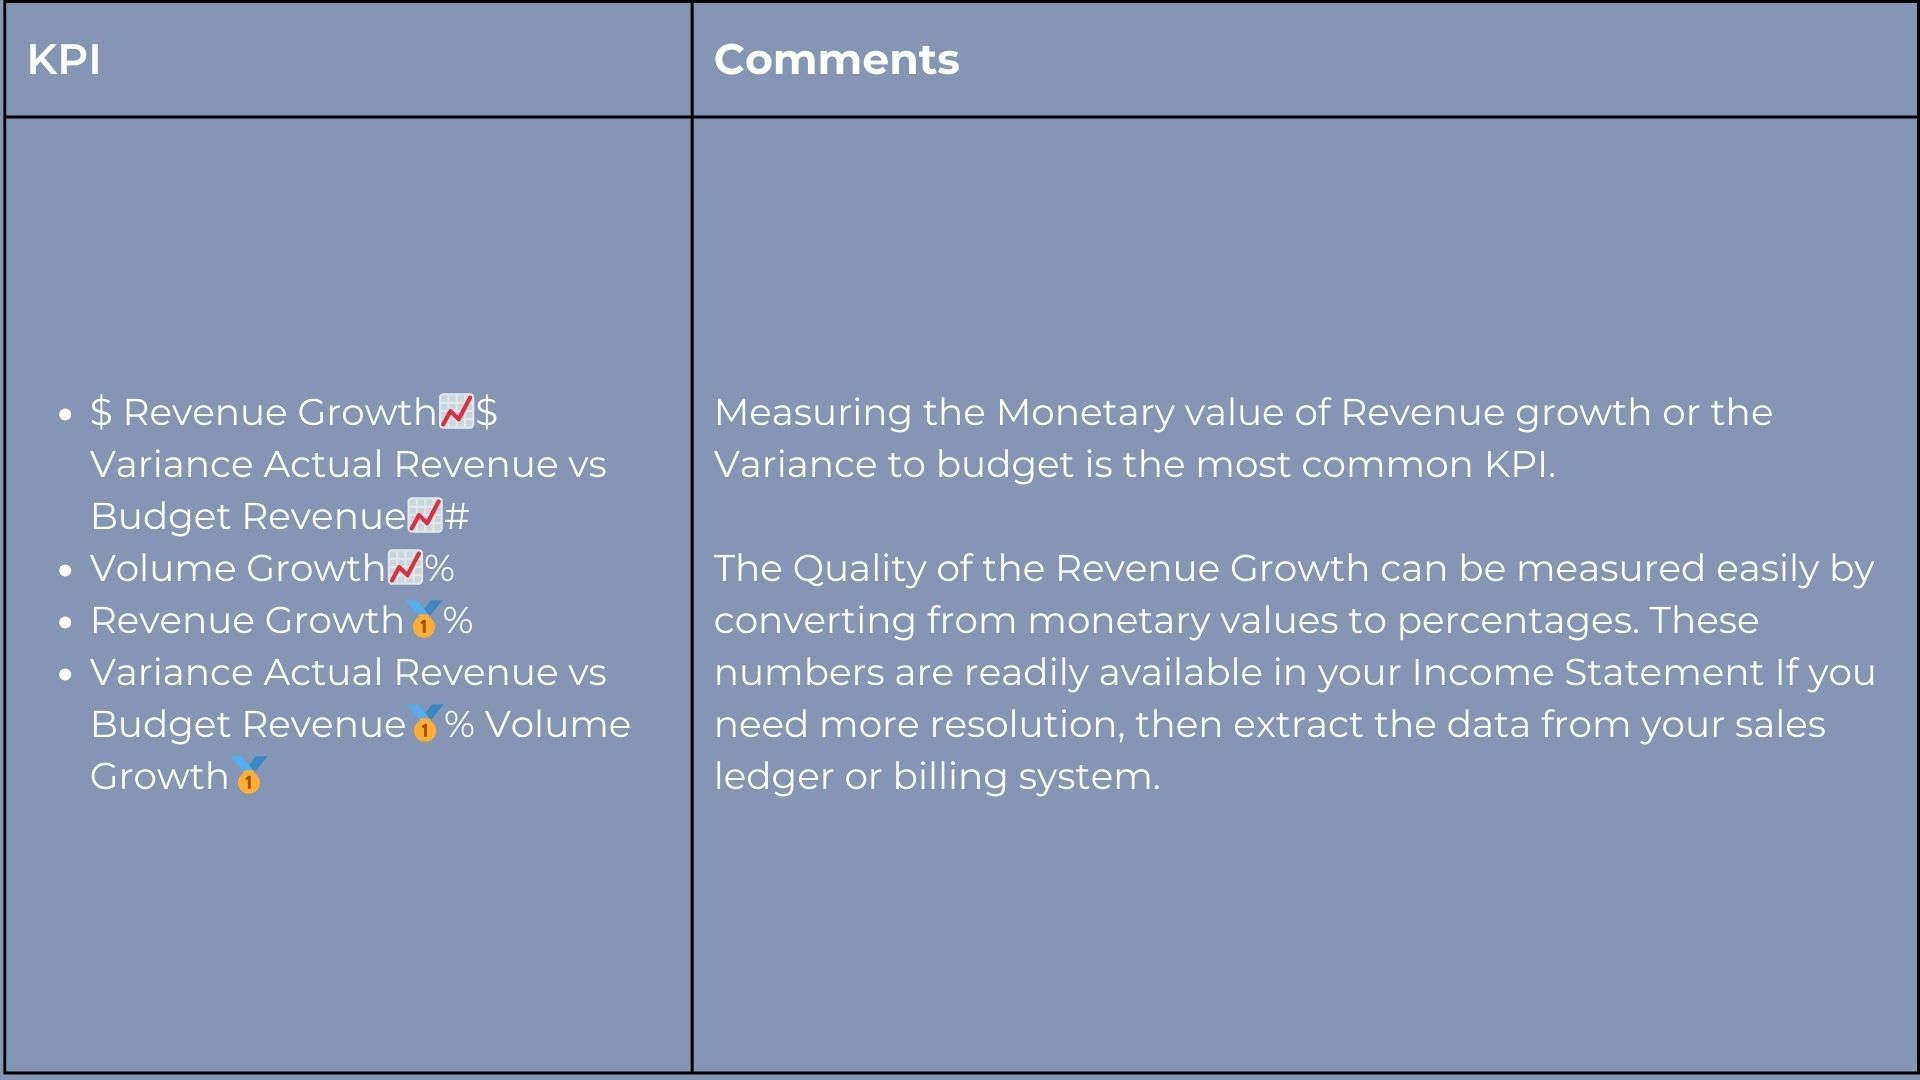
Convenient
Ideal
3. Customer Centricity - The Winger
The one that creates the required attacking momentum
In football, the winger is crucial for moving the game forward toward the goals. They pass the ball to the striker or the goal assist to achieve a favourable result. Wingers are fast, agile, and find ways to attack. Their work may seem monotonous, but it suddenly converts into opportunities for the forwards to capitalize on.
In business, client centricity and satisfaction play a similar role, creating loyal clients who are easier and more profitable to sell to than new customers. This is mainly executed by the client services team and account managers, who are vital for client retention, upselling, cross-selling, and new customer acquisitions.
Client centricity can either directly contribute to profit or boost revenue growth. Great service and relationships make it easier to achieve business goals. These teams interact daily with clients, providing excellent service and maintaining strong client engagement and relationships.
Pick A KPI
Easy
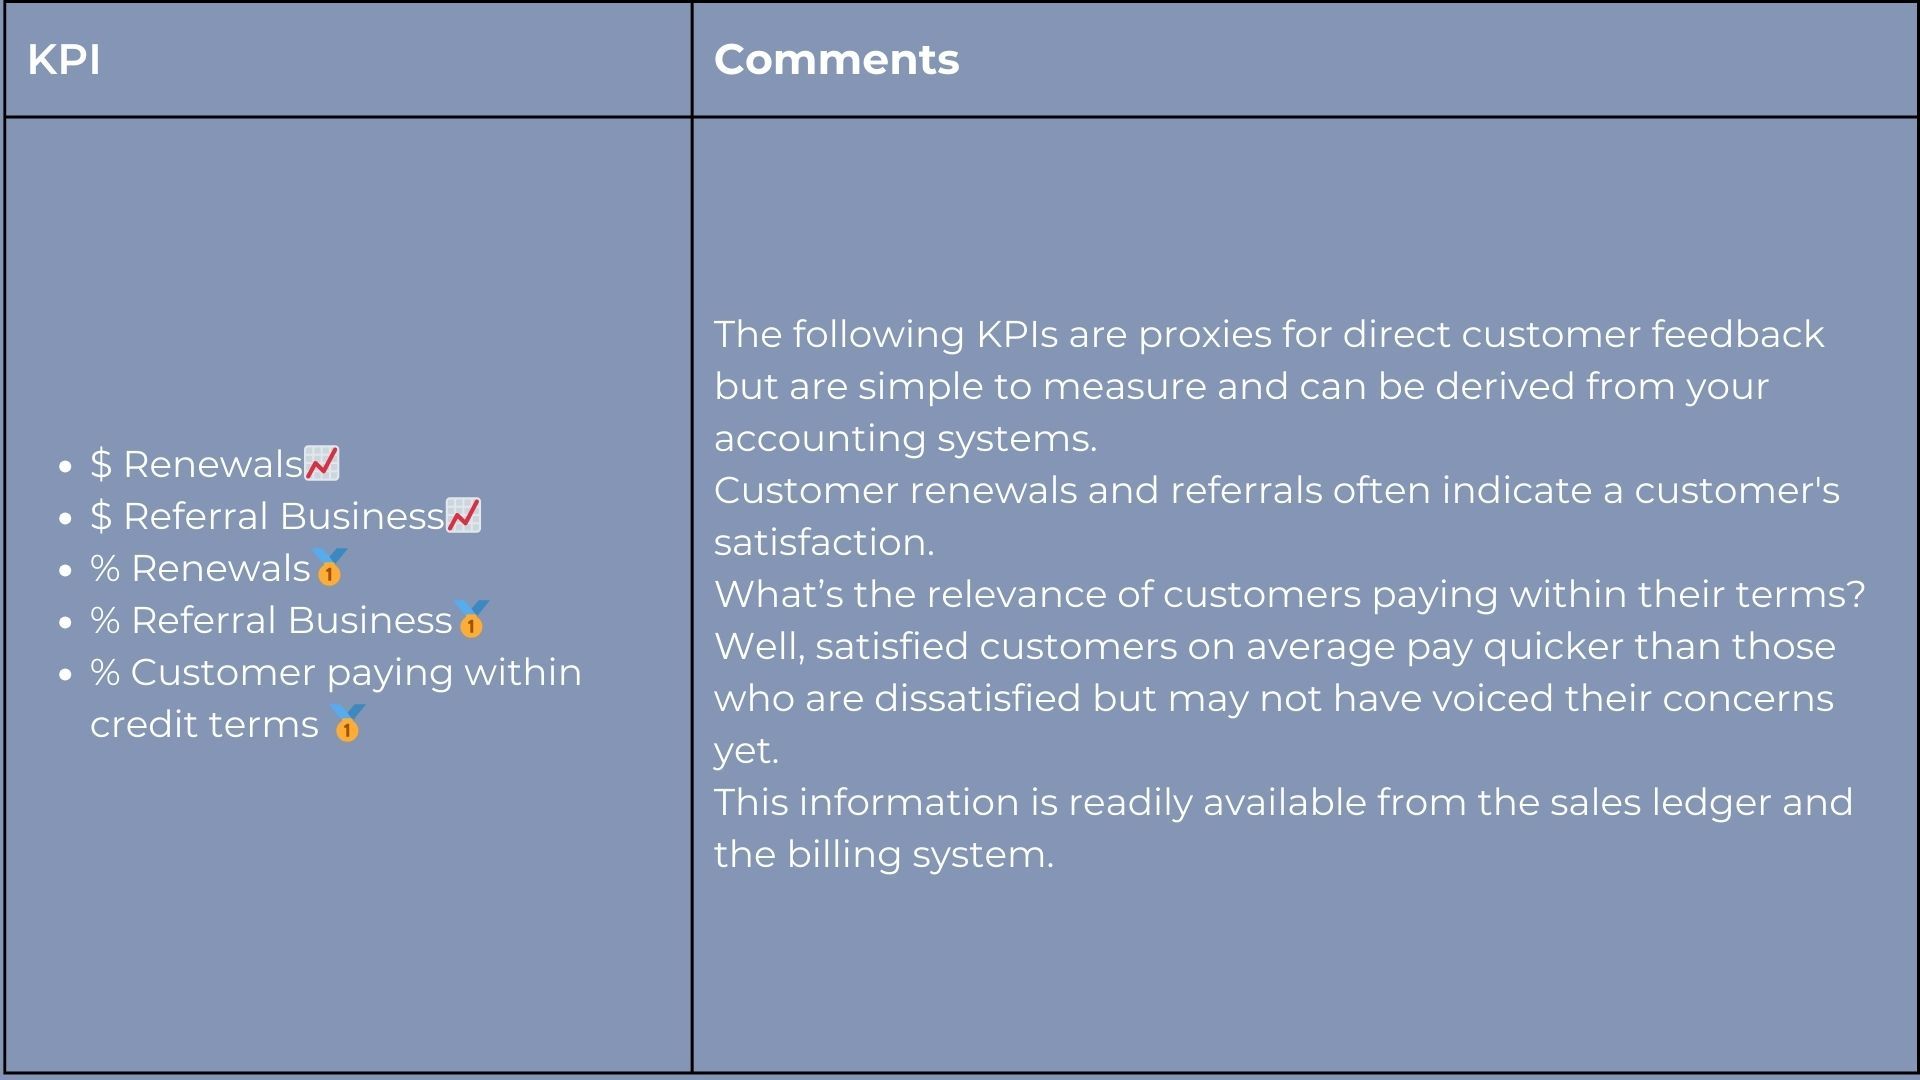
Convenient
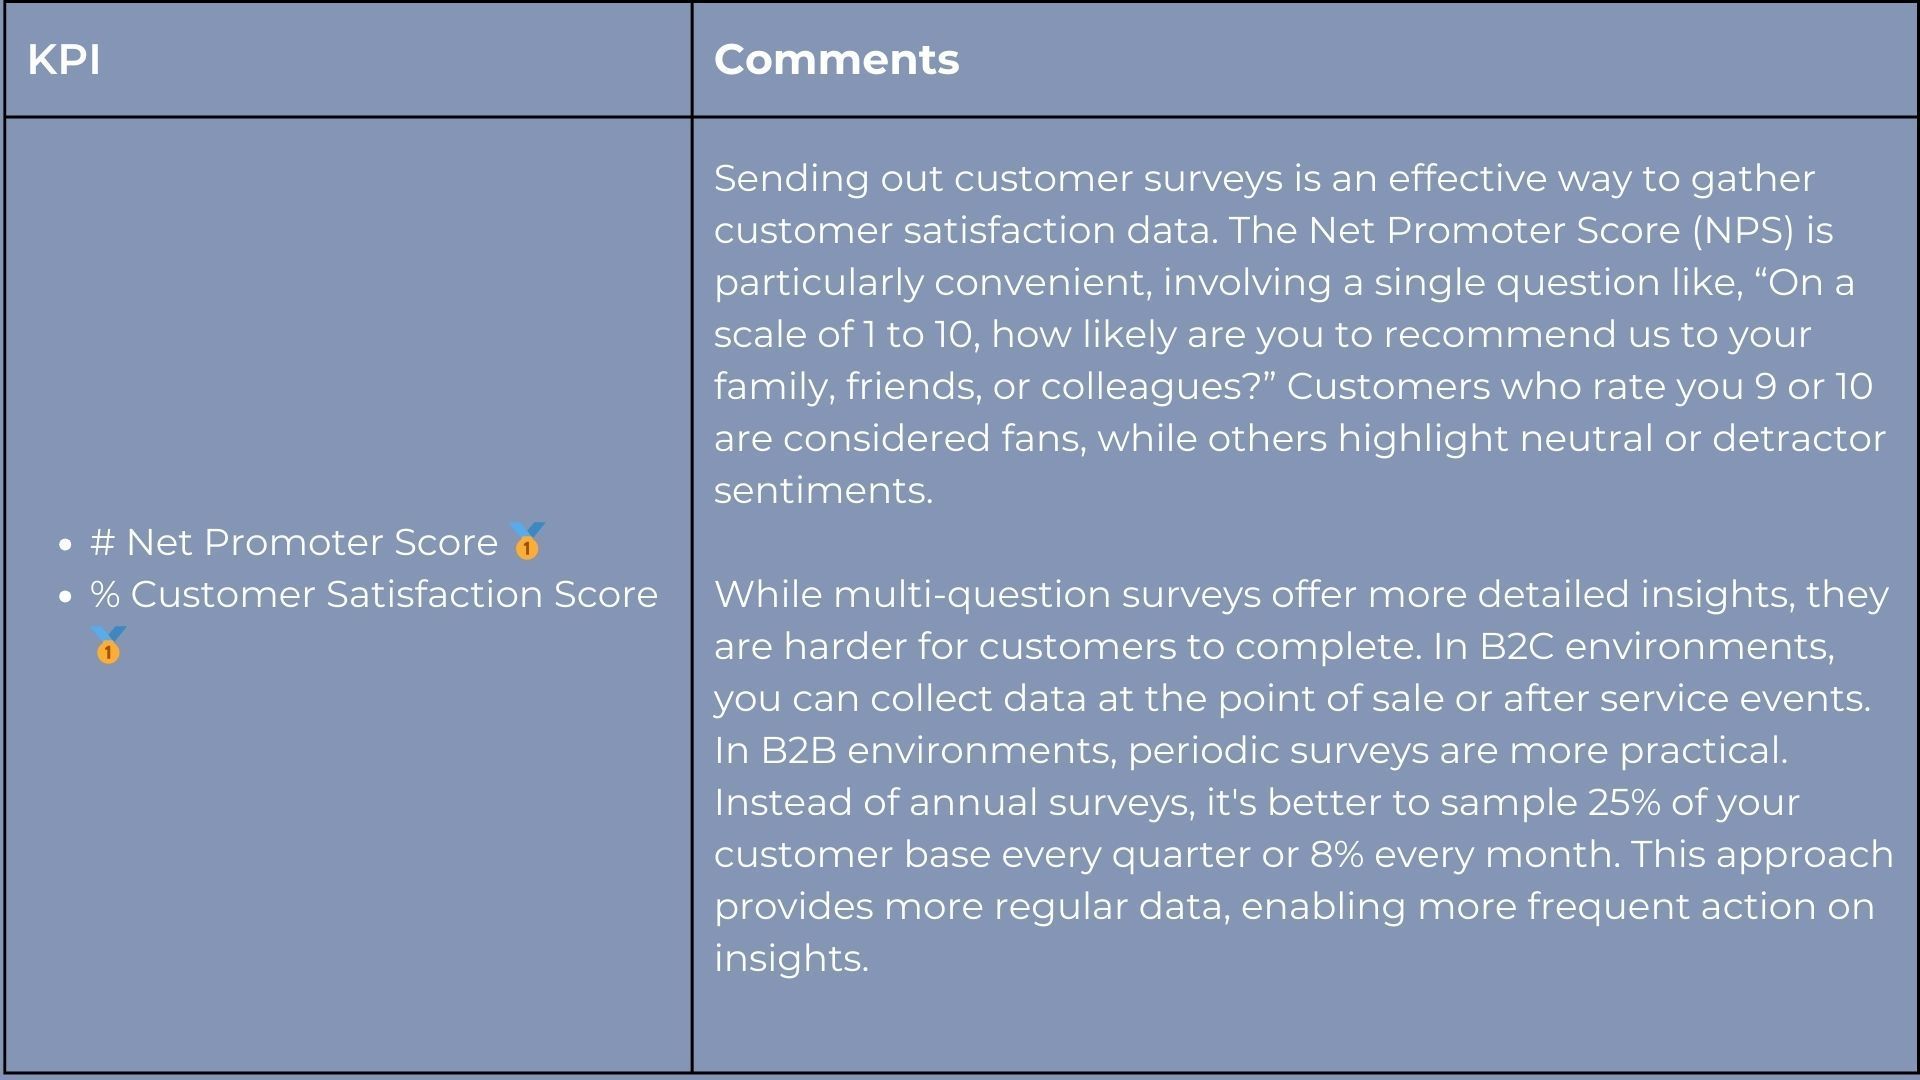
Ideal
4. Strategy - The Midfielder
This is the Thinking Player who is sets-up the Structure for Success.
In Football, they are key to stealing the ball, taking control of possession, and distributing the ball. They help transition play, initiate counterattacks, and support the build-up towards the goals.
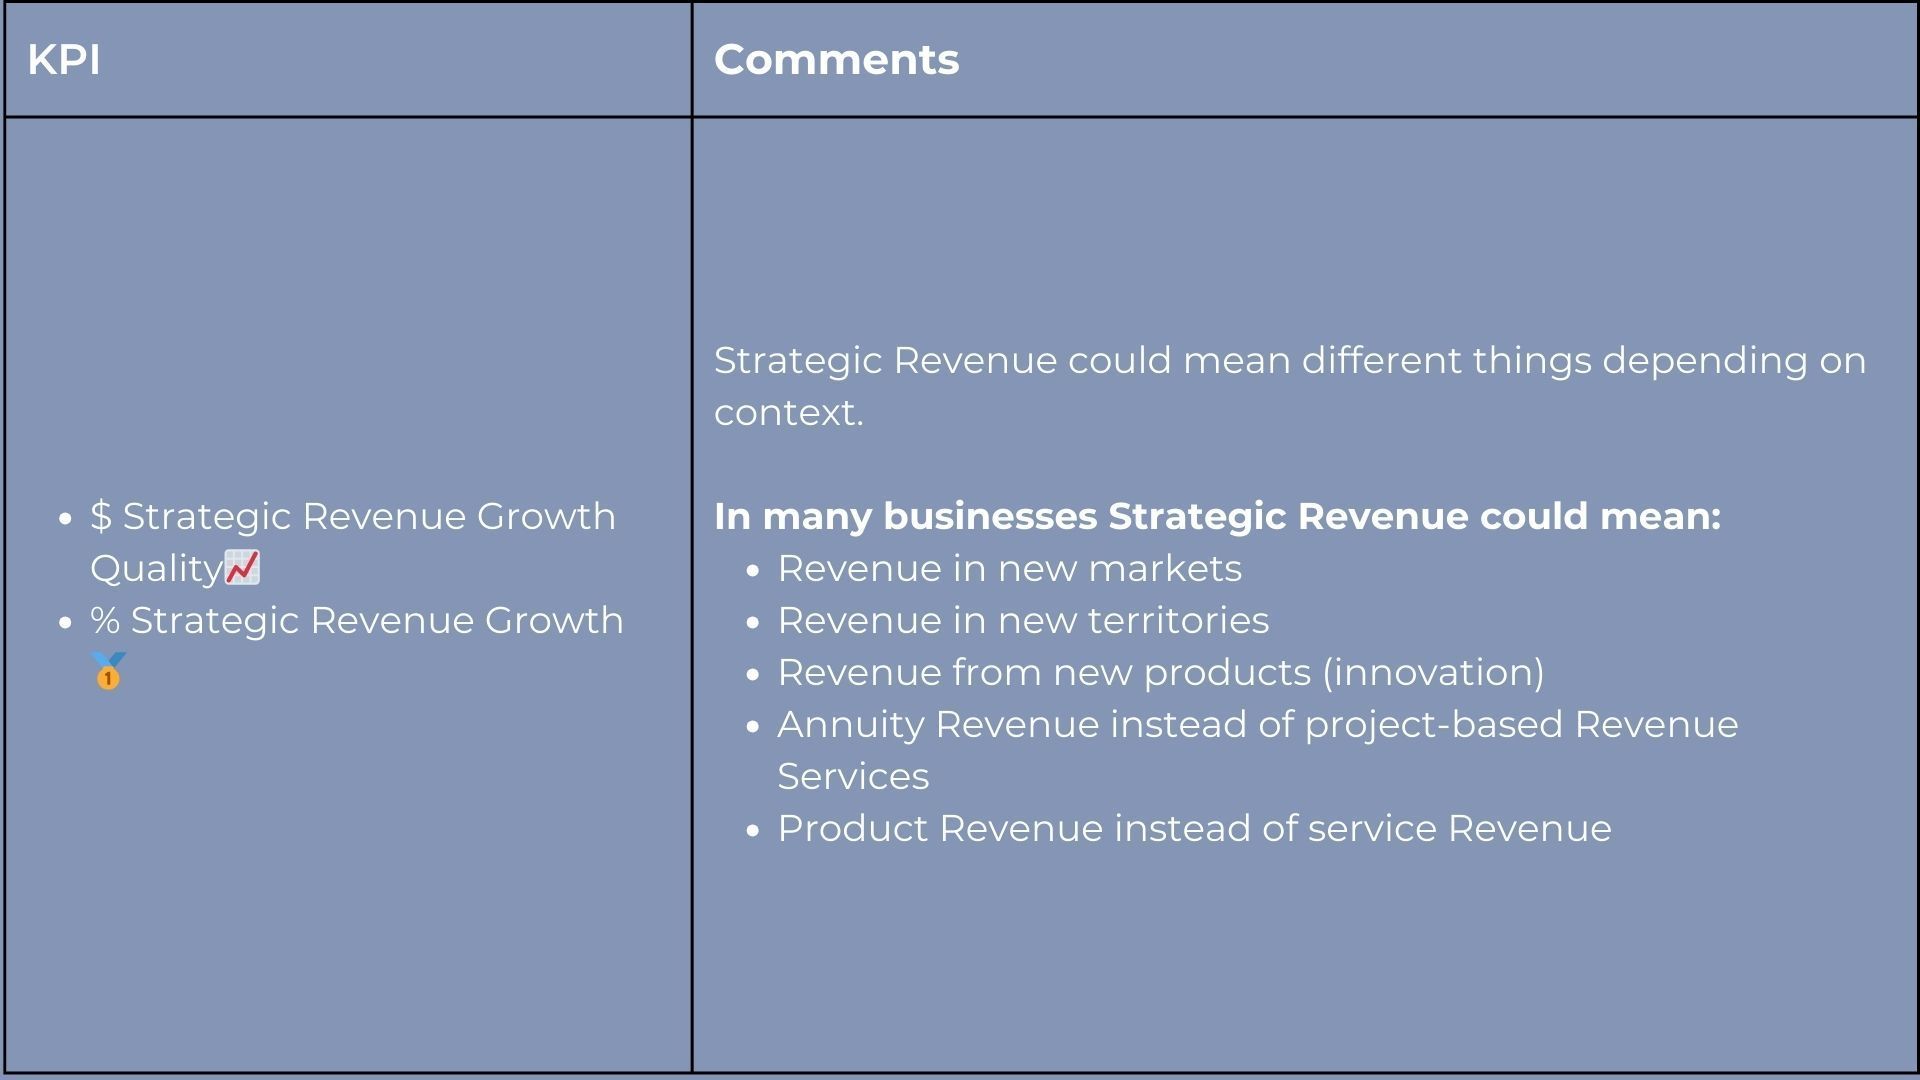
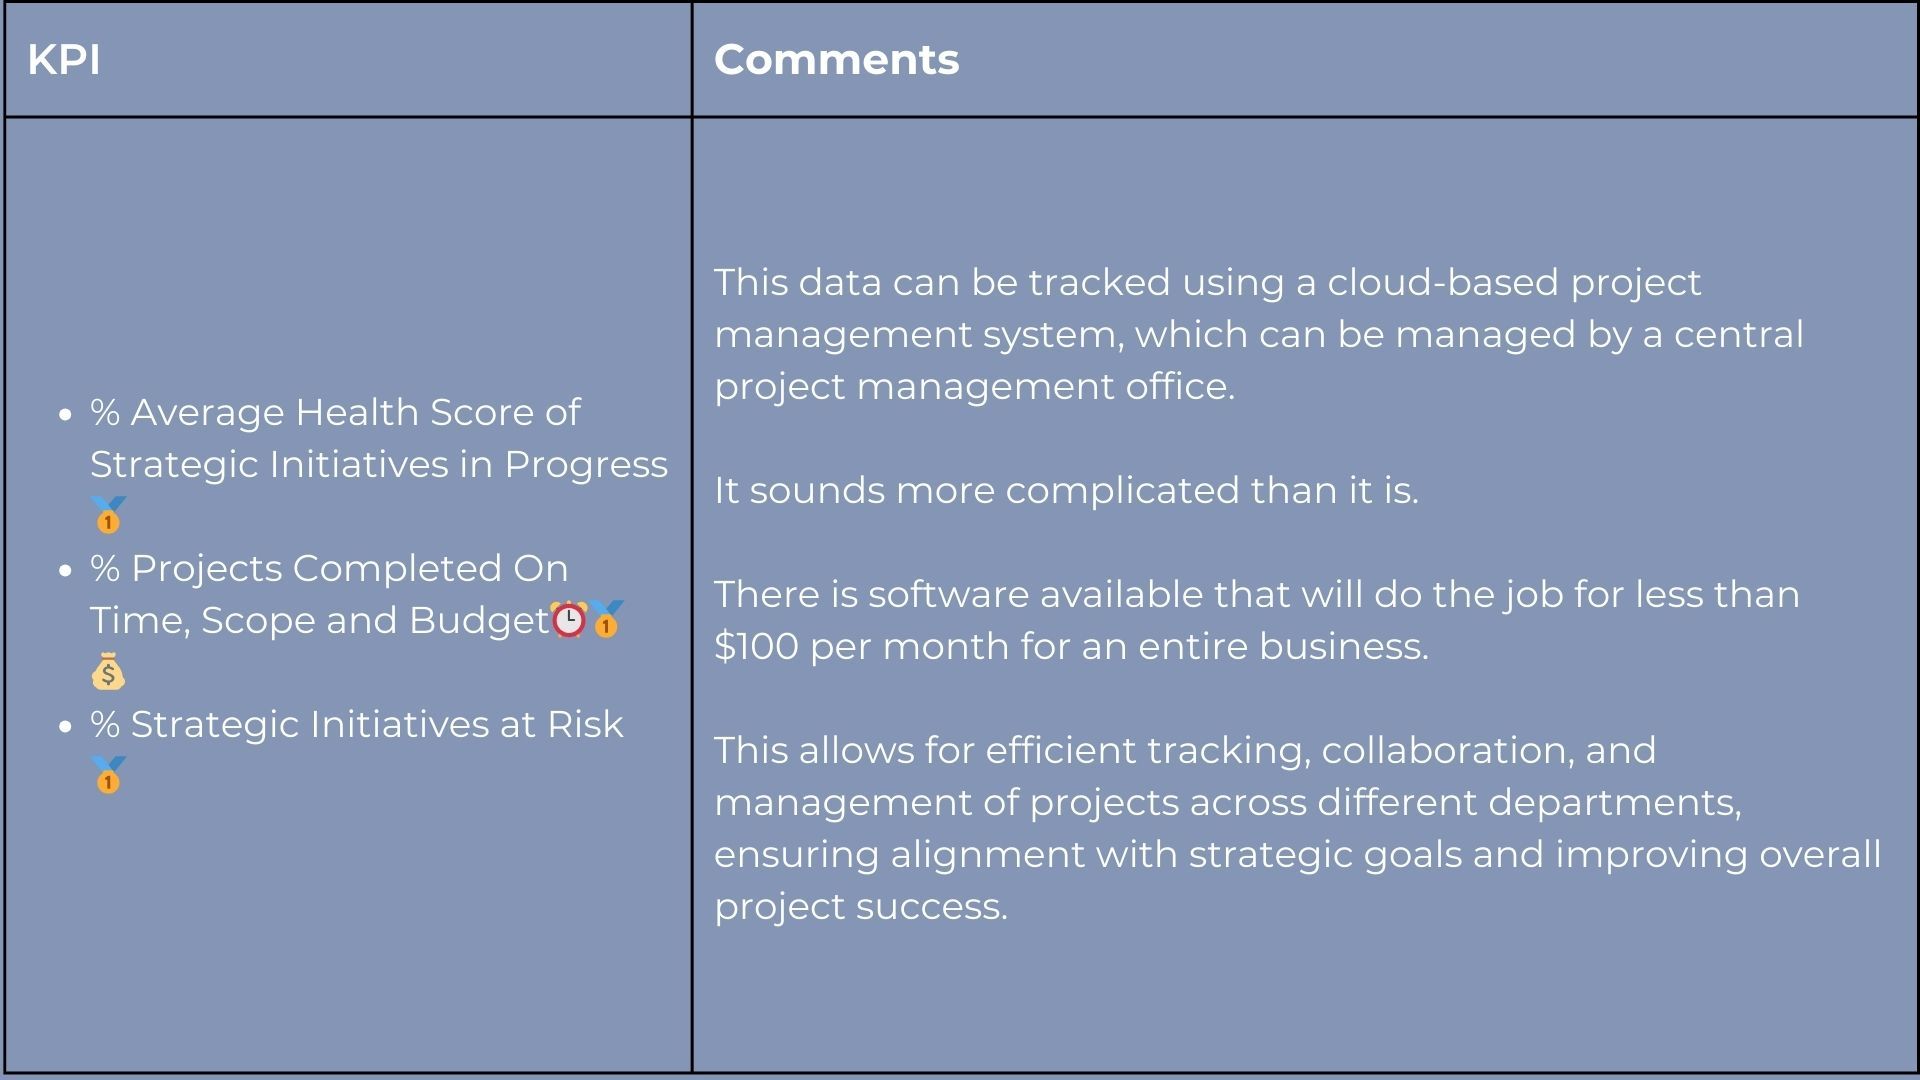
In business, the strategy sets the direction to address opportunities for both the top line and the bottom line. It also helps the business prepare for future success by building or improving capabilities from which future successes will flow. Strategy is mostly executed through strategic programs and projects that must be aligned. The problem with projects is that they often fail because they:
- Weren’t set up correctly with the right goals and deliverables, reasonable timelines, and resources.
- Were not managed professionally, or
- Resource constraints become a reality as people are caught in business-as-usual activities or other competing projects.
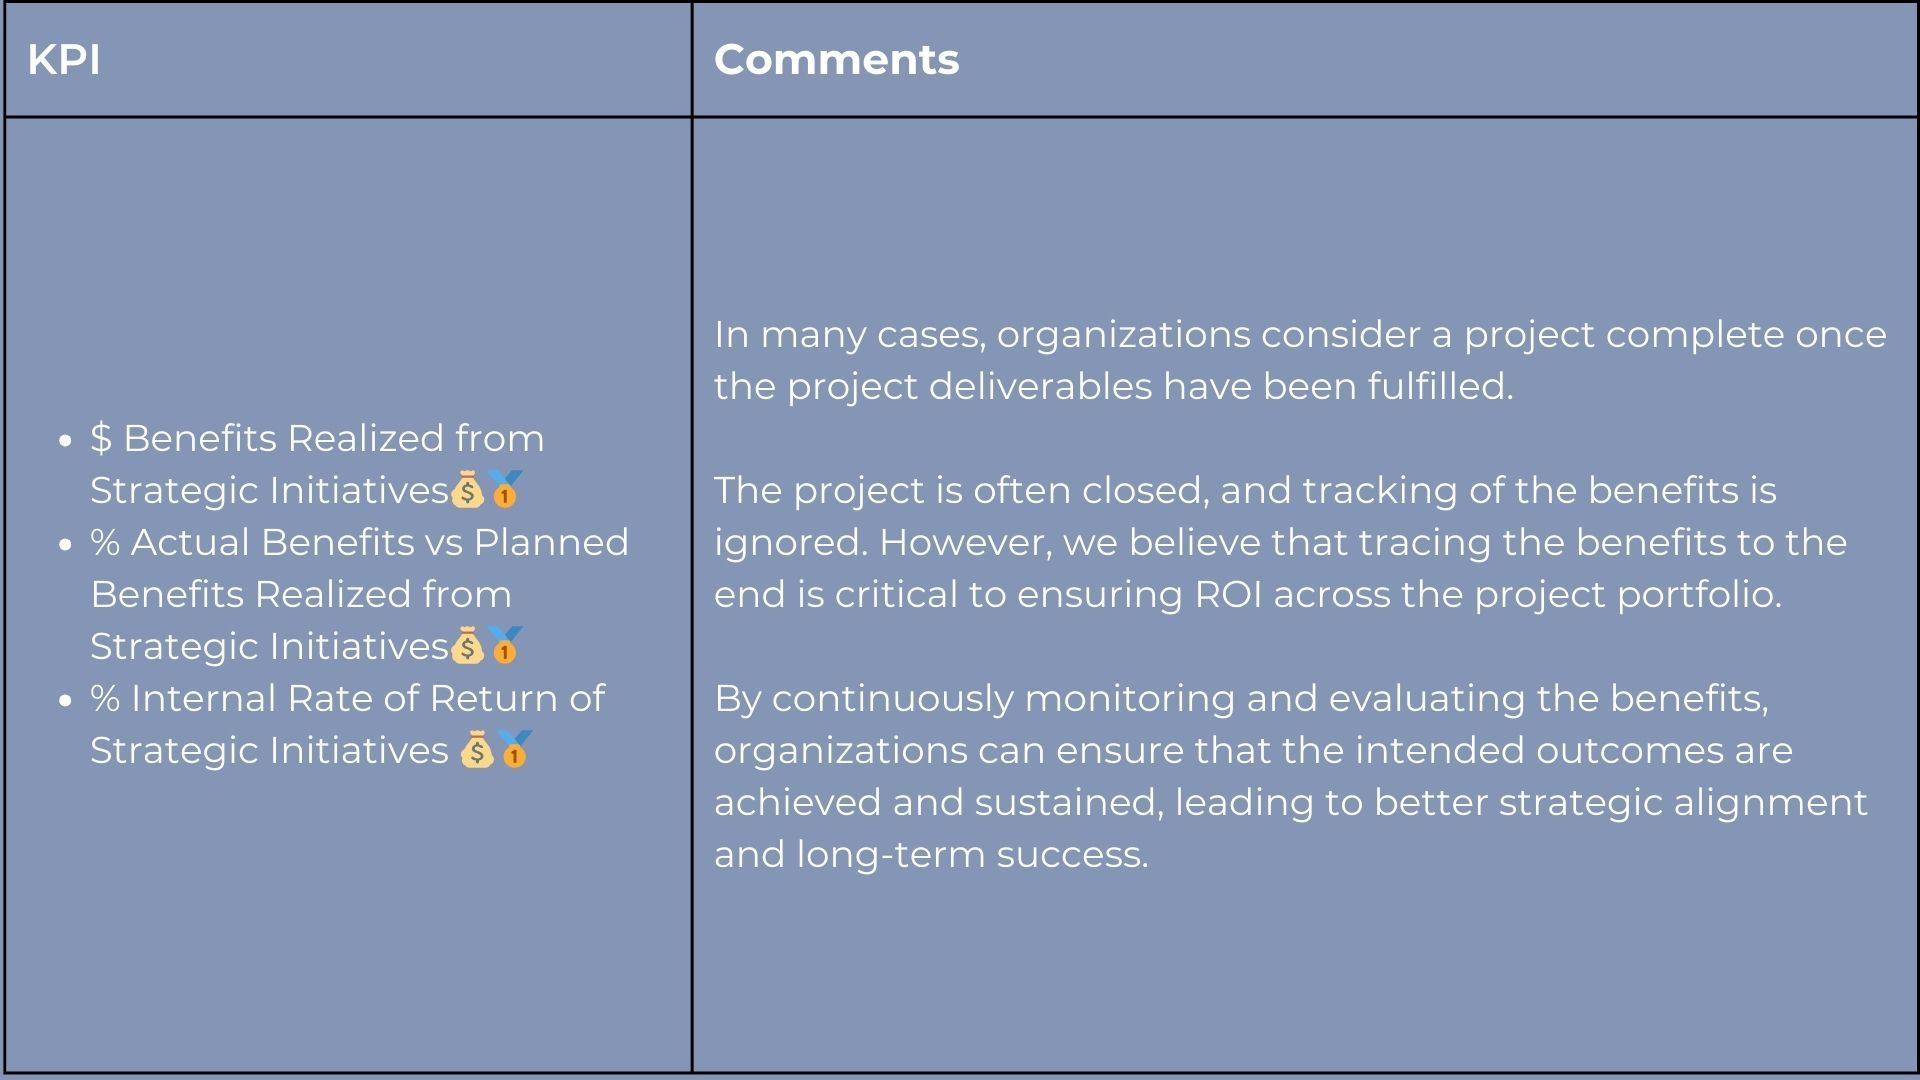
Project success is a leading KPI for future business operations.
It is one of the most significant leading KPIs, yet many organizations fail to execute strategic projects and don’t invest the necessary time, money, and resources.
In recent years, OKRs (Objectives and Key Results) have become very popular, following the success of Google (read "Measure What Matters" by John Doerr) and other tech companies using this approach.
OKRs have their own philosophy, and businesses should ensure they understand the system rather than picking and choosing convenient parts. That said, it’s super simple and has the following characteristics:
- It’s focused on one quarter at a time.
- Goals are mostly stretch goals. Reaching 70% of objectives is considered good. Consistently reaching 100% of objectives is considered negative, as it means the team isn’t stretching themselves.
- OKRs are perfect for building capabilities, i.e., working “on the business” rather than “in the business.”
- It’s a transparent approach, so everyone can see everyone else’s OKRs (performance).
- Requires weekly check-ins.
- Can be driven top-down, bottom-up, or sideways.
- Ideal for environments characterized by consistent change, high innovation, or the need for very specific results, such as drastic cost-cutting within a quarter.
- The success or failure of OKRs shouldn’t be linked to incentives.
Pick A KPI
Easy
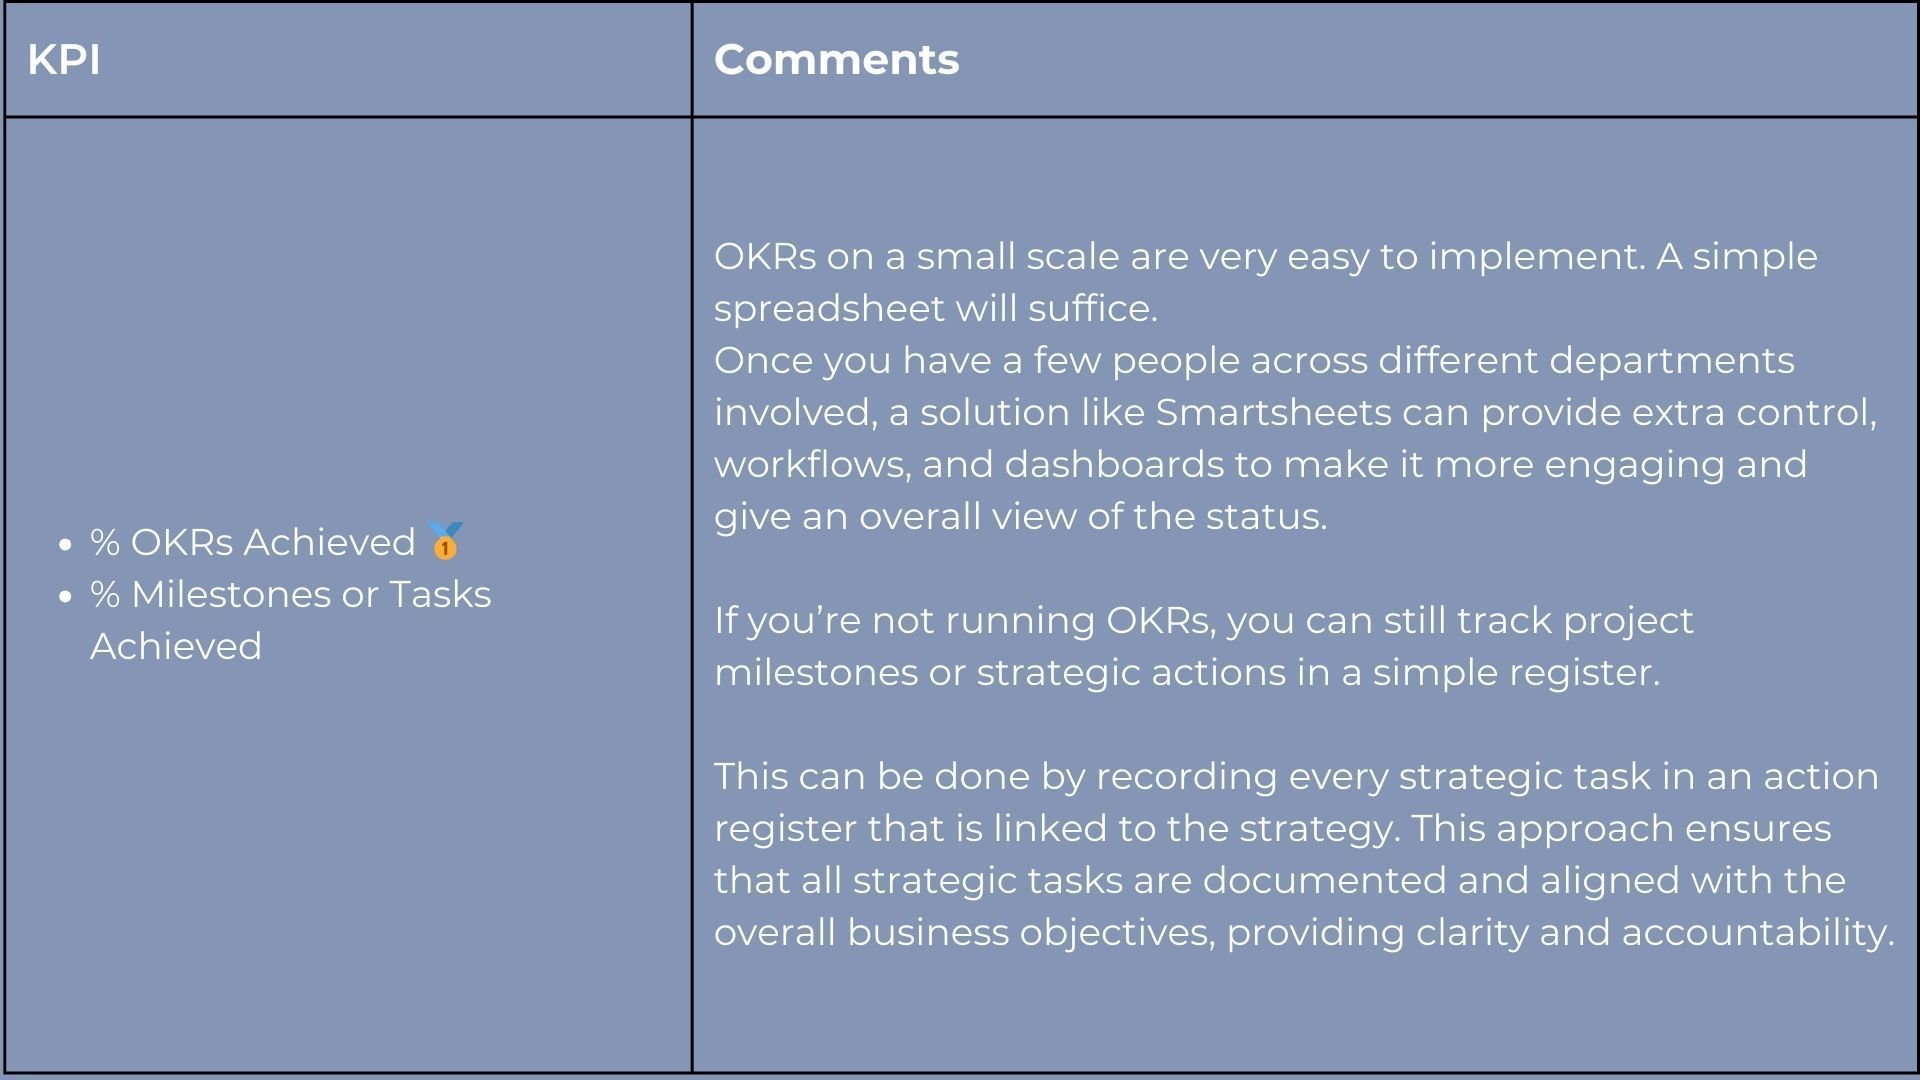
Convenient
Ideal
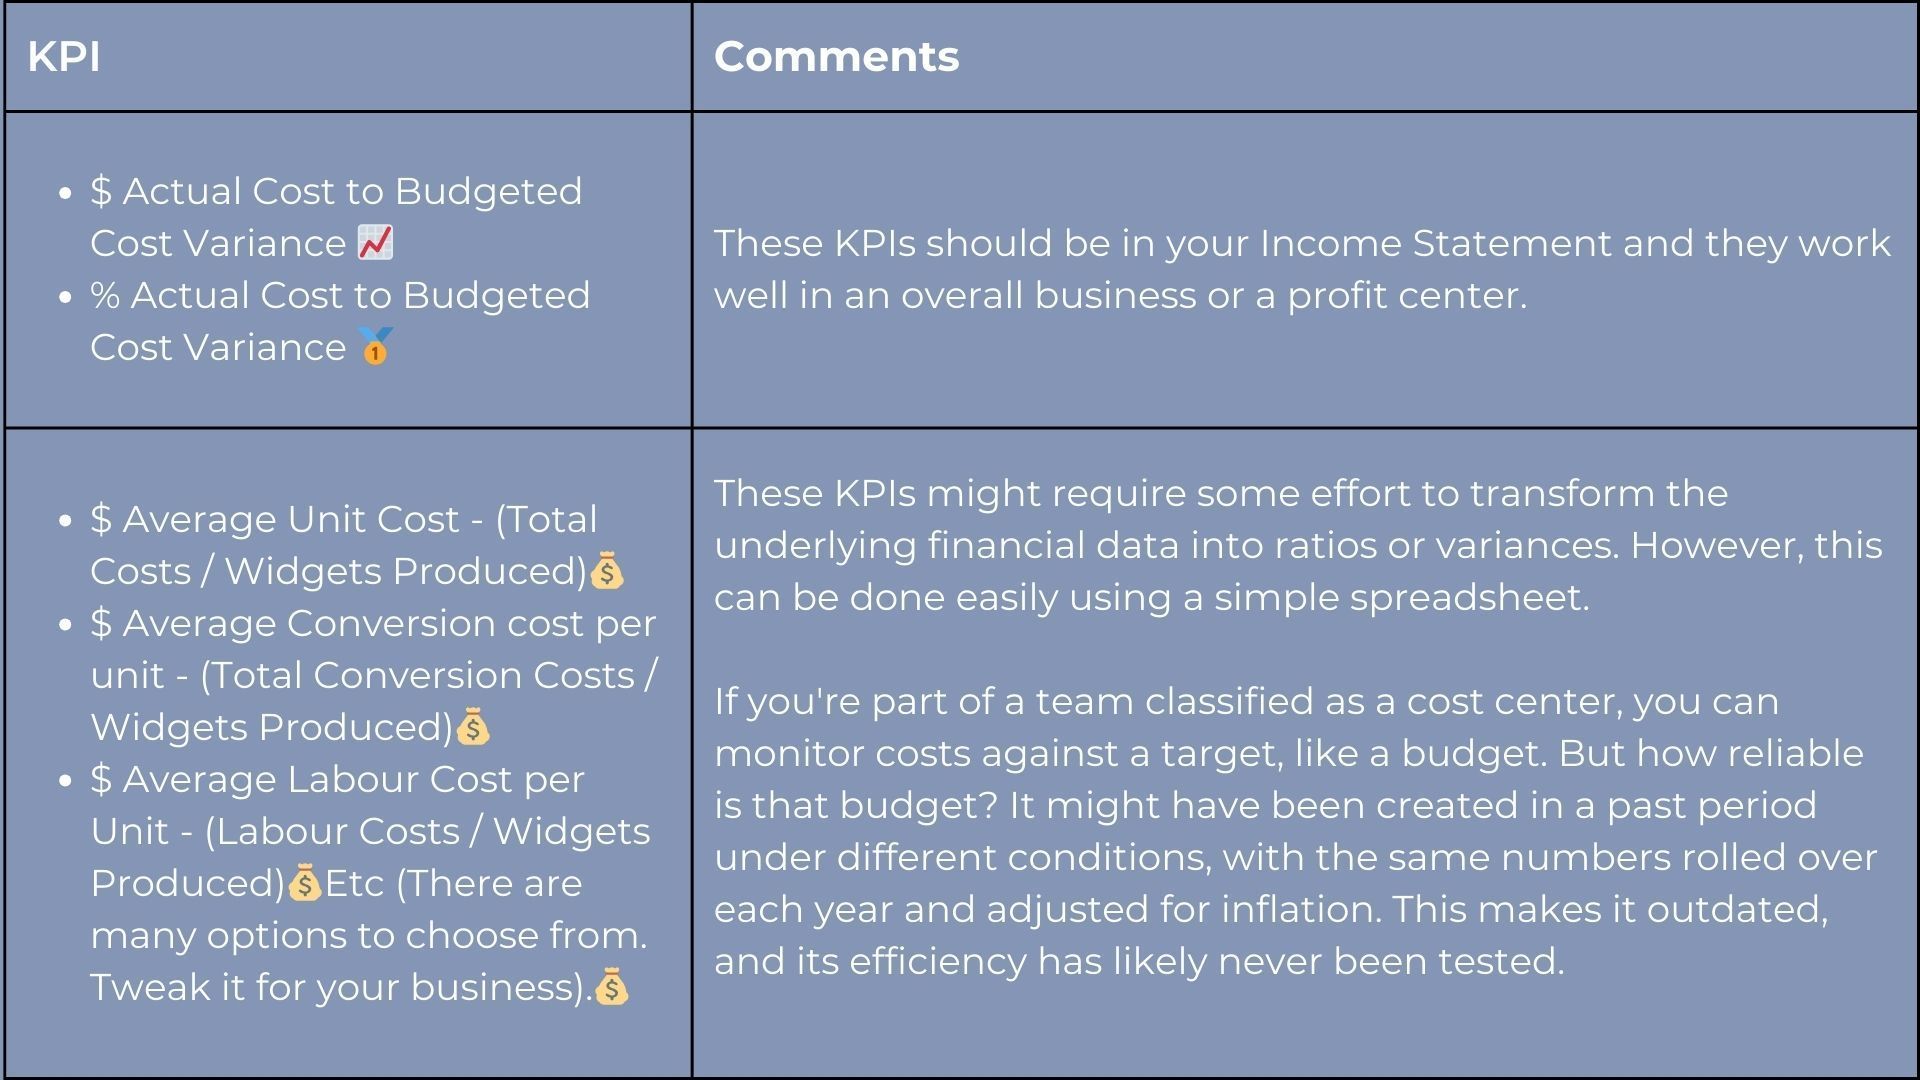
5. Process - The Defence
This is the player that keeps it all together and plays hand in hand with The Winger
You do not rise to the level of your goals. You fall to the level of your systems.” - James Clear, Atomic Habits
In football, defenders are the backbone of a team's defence, providing stability, resilience, and security to ensure the team's success on the field. They don’t panic; they execute their processes according to the game plan, ensuring quality, consistency, steady output, controls, and risk mitigation against the opposition.
In business, systems and processes are the foundation that run the business and determines the products and services delivered to customers. Processes influence the profits for shareholders. Your customers experience the sum total of your processes, delivered through your systems and people. If your processes don’t work, your customers will feel it, whether they pinpoint it or not.
Processes should be focused on delivering value to the customer in terms of price/cost, quality, and timeliness. Customers include internal customers. If you’re in a cost centre or service area, your customer will often be a manager in a downstream team. Treat them as customers.
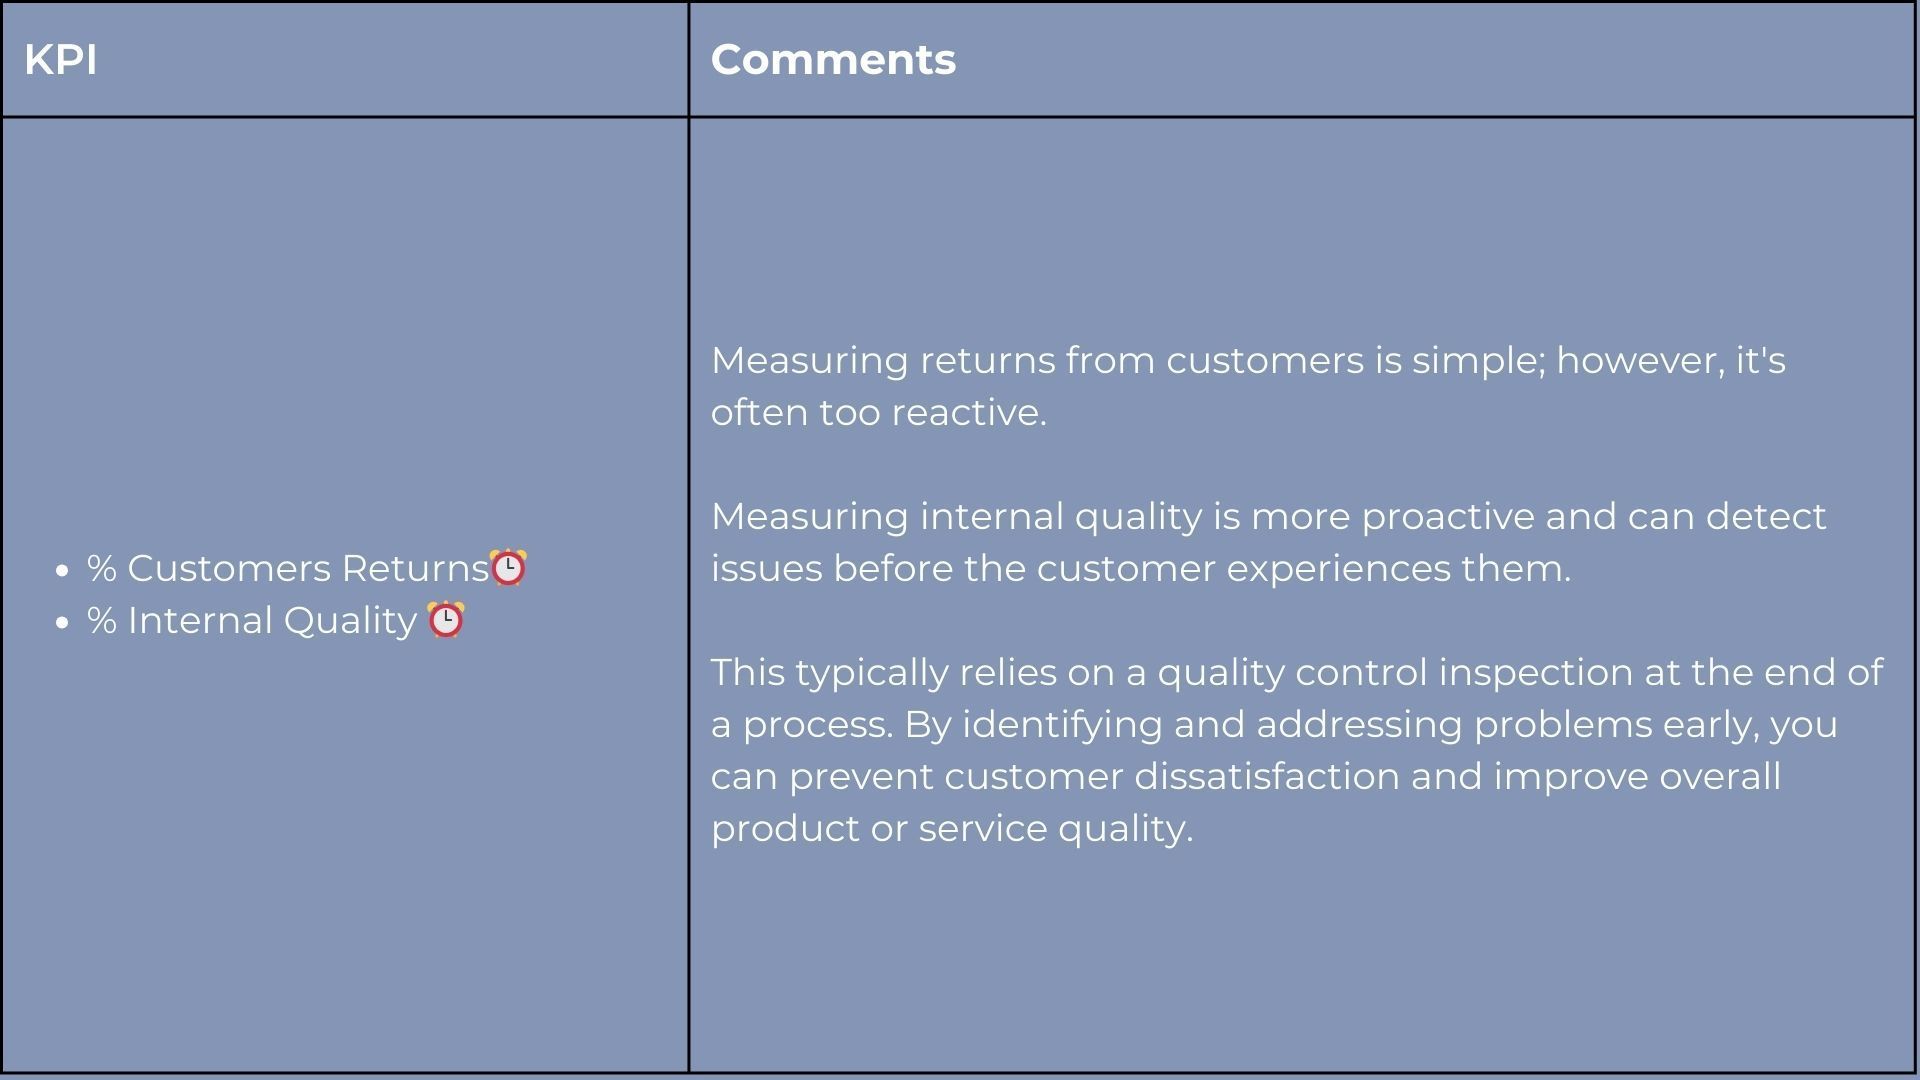
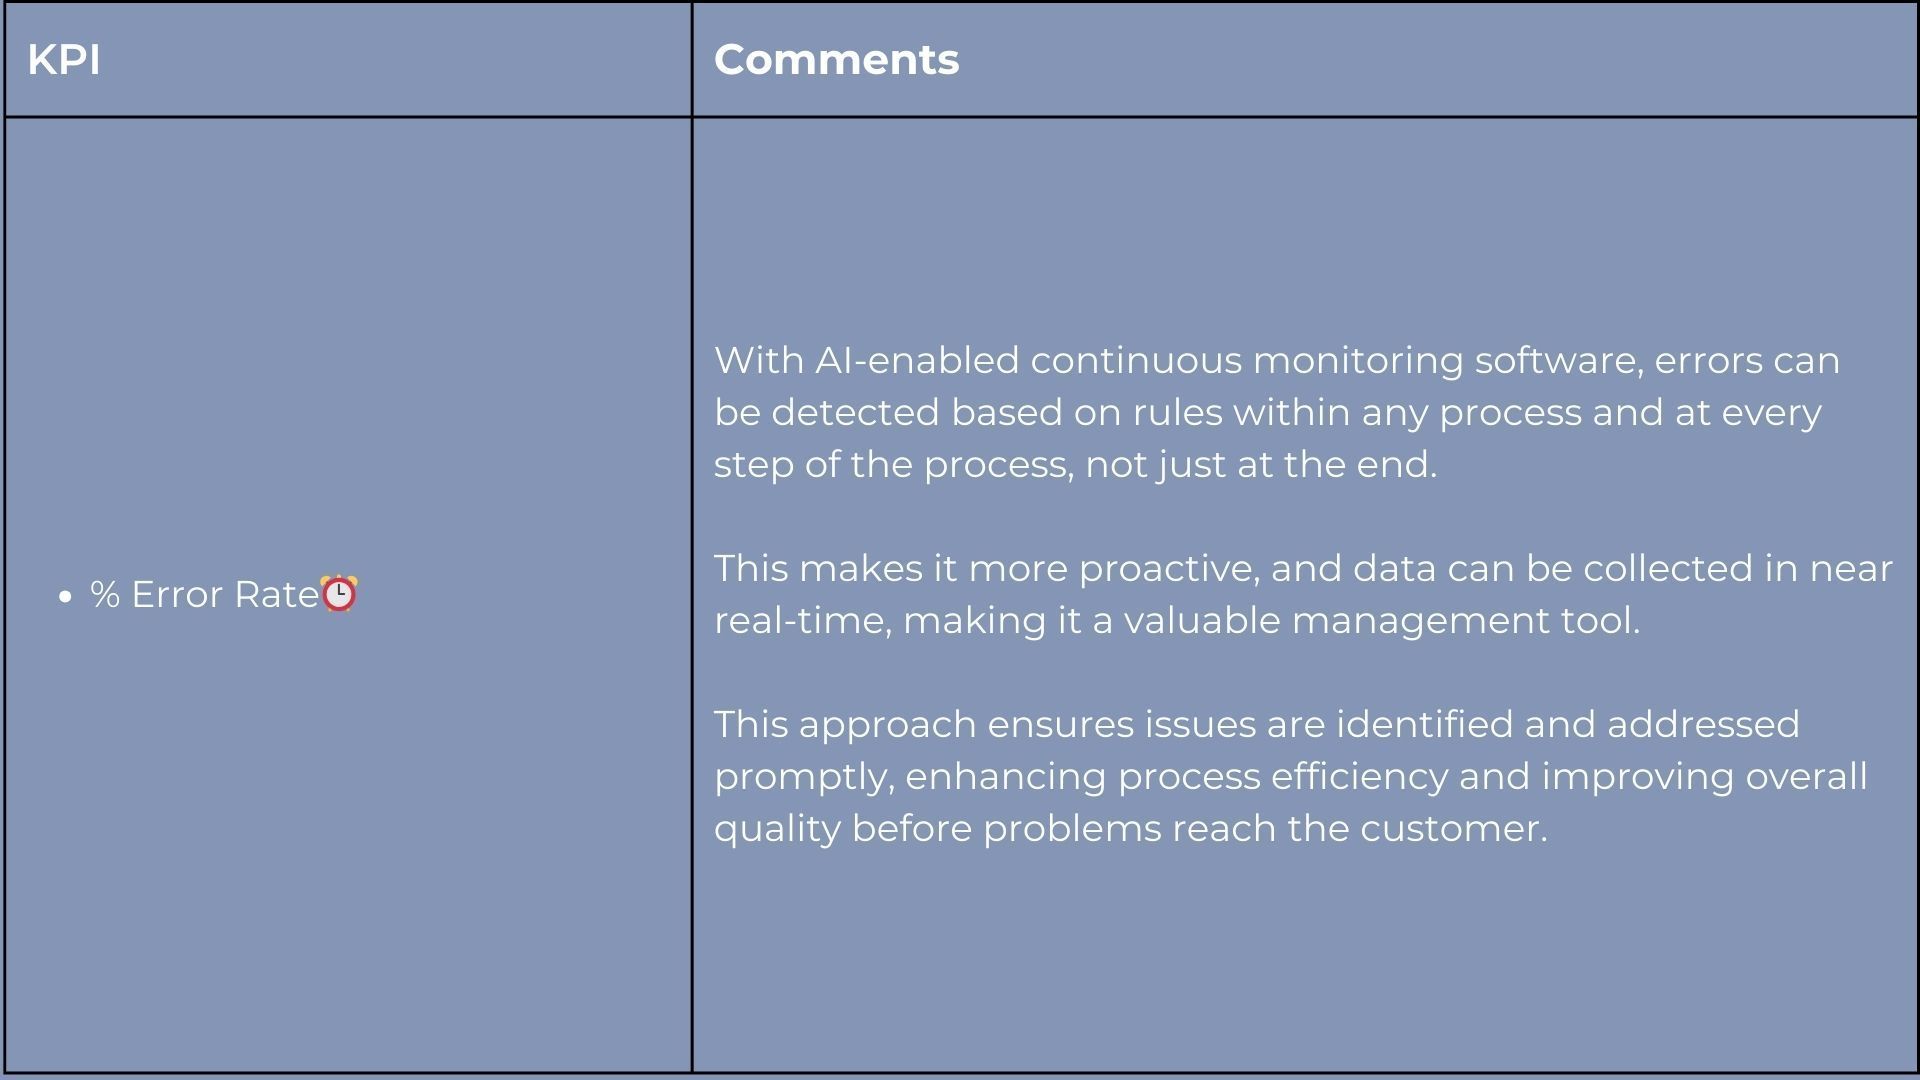
Processes are best when they’re documented, repeatable, and standardized across the organization, producing clean, reliable data that can be converted into metrics and KPIs. If they don’t, consider reimplementing your processes through a strategically managed project. Once properly implemented, processes should produce data that enables the measurement of productivity, quality, and due-date performance. Additionally, processes will help measure controls and mitigate operational risks.
Process and customer centricity go hand in hand.
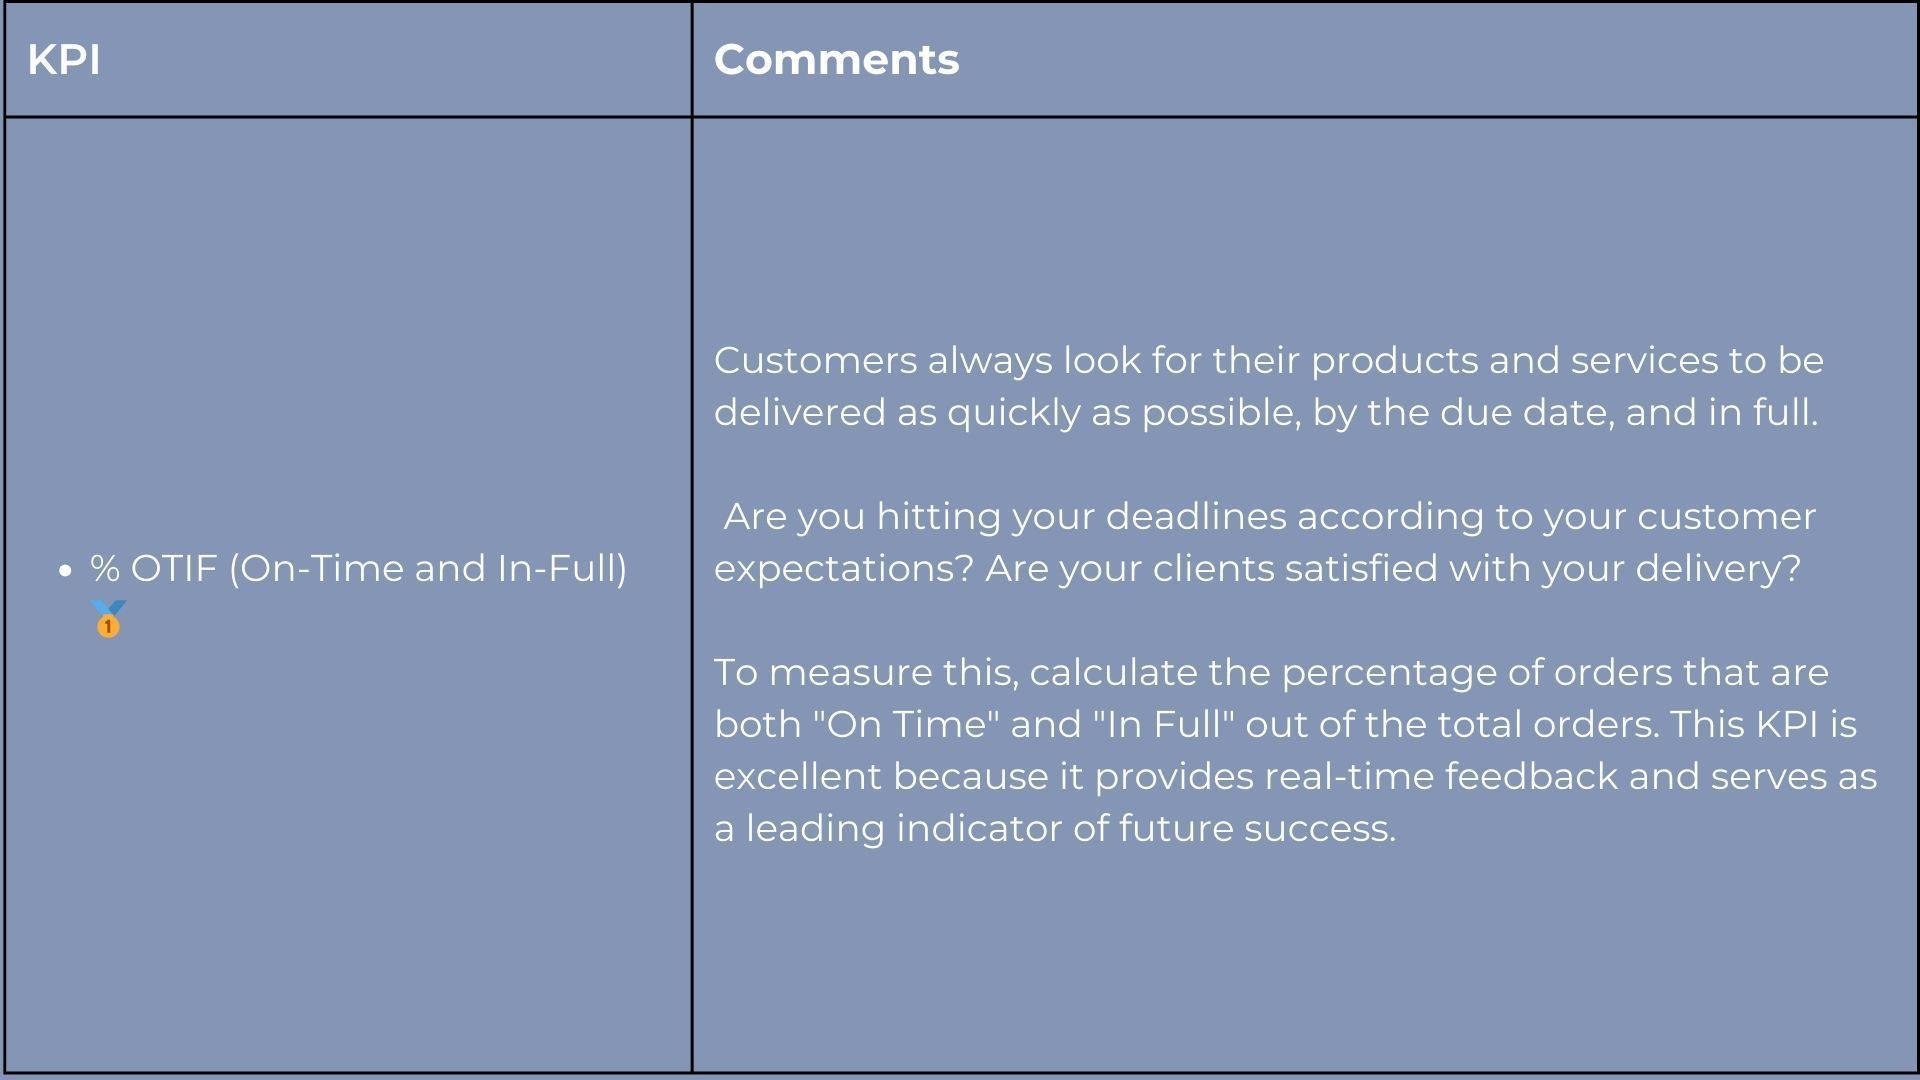
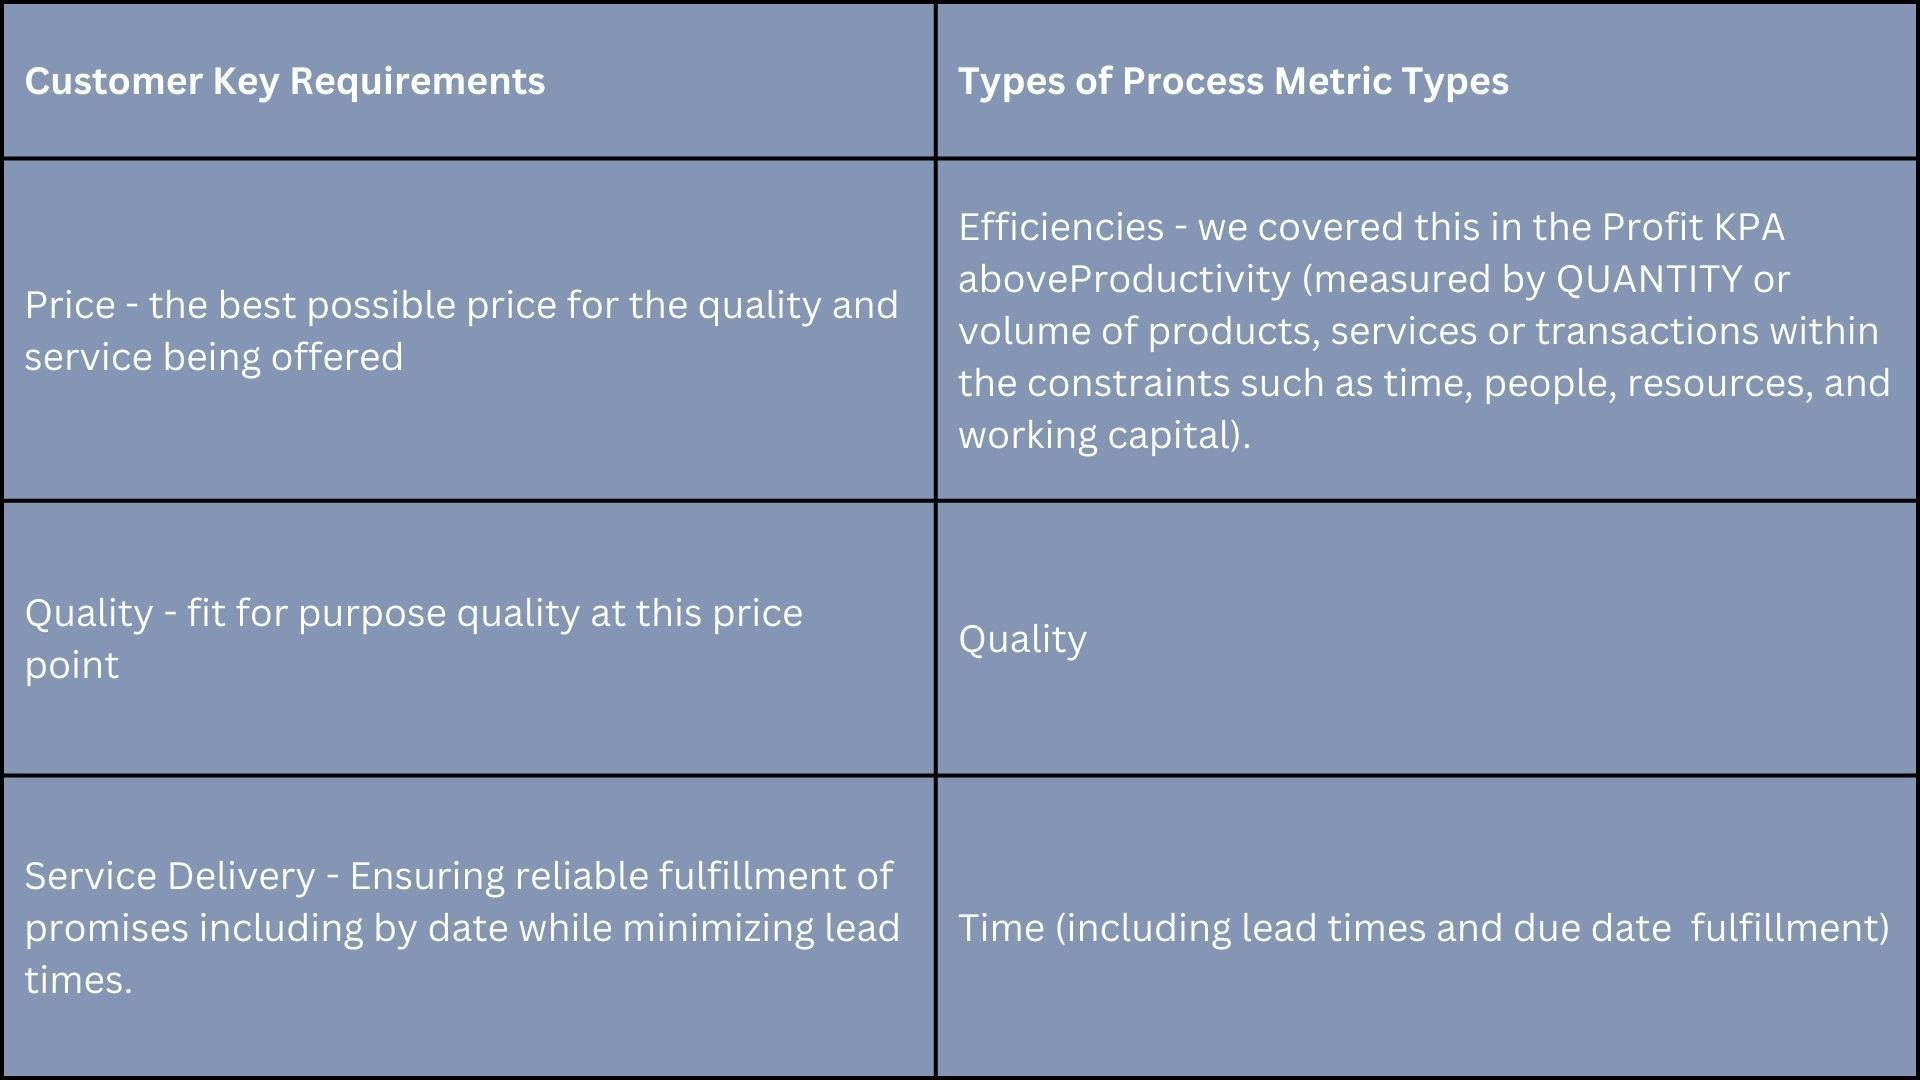
In different industries, there are many variations of metrics, but typically your customers will be looking for three key things:
- Price/Cost: Are your products or services priced competitively?
- Quality: Are your products or services meeting the quality standards expected by your customers?
- Timeliness: Are your products or services delivered on time or by the committed due date?
Ensuring that your processes are reliable is the key to success.
Pick A KPI
Easy
Convenient
Ideal
6. Capability - The Goal Keeper
The Last Line of Defense and the Most Fundamental Position Needed to Survive
In football, the goalkeeper is the last line of defence. Without a goalkeeper, the goals are open, and the team will most likely never win a match. The opposition will exploit this weakness. The team can survive and the game can continue without any other position, but not this one.
In business, skilled resources are fundamental to starting, running, and scaling a business. Without the right skills, the business will it's score own goals time and time again, regardless of the sophistication of the IT systems. Even in a highly automated business, skills are needed. For instance, in an automated business, skills such as the capability to program, monitor, and manage bots are essential. Ultimately, it comes back to at least one human with the required level of skills.
Continuous learning and investment in skills and capabilities lay the foundation for success. Skills development is a never-ending task. We call this Capability, which is a combination of an individual’s education, experience, training, technical skills, soft skills, and track record.
Investing in capability ensures that your team can handle challenges, innovate, and maintain the smooth operation of your business. This ongoing investment in skills and capabilities is essential for long-term success and resilience in any industry.
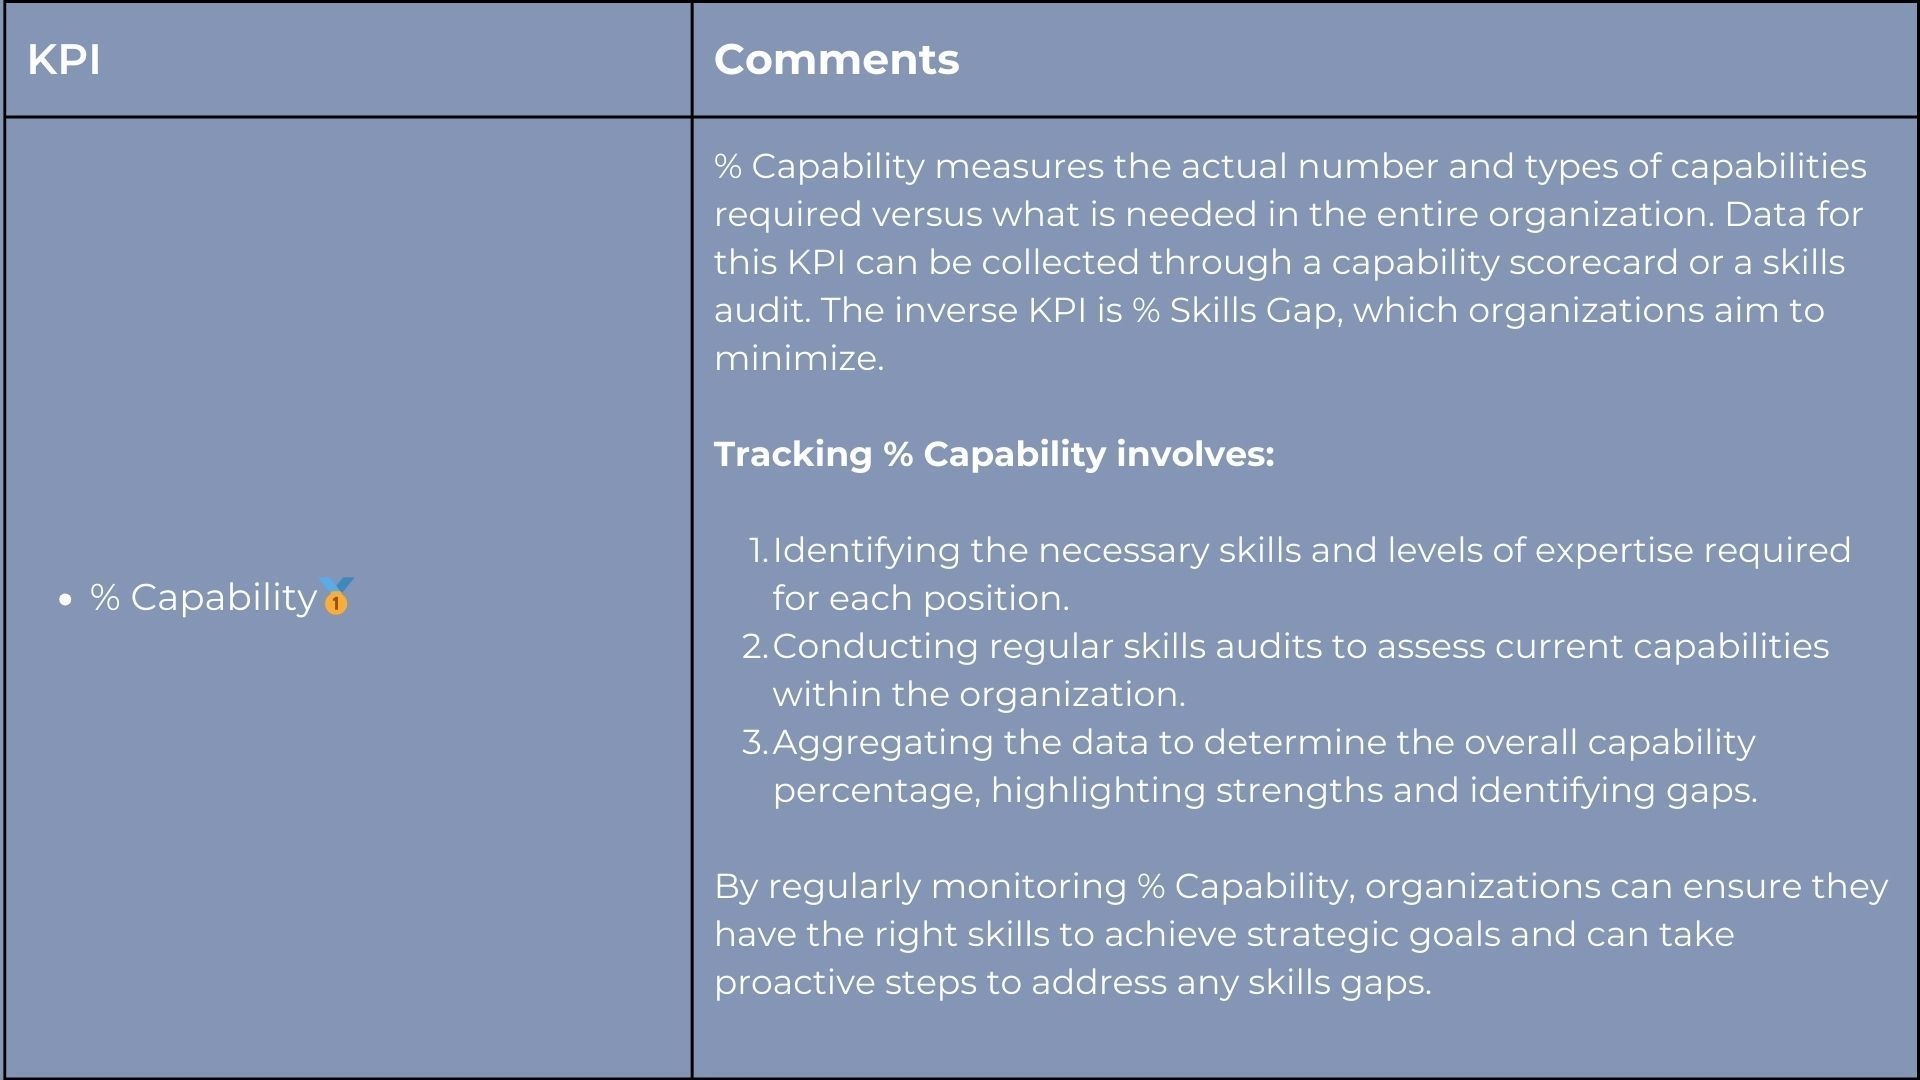
Pick your KPI:
Easy
Convenient
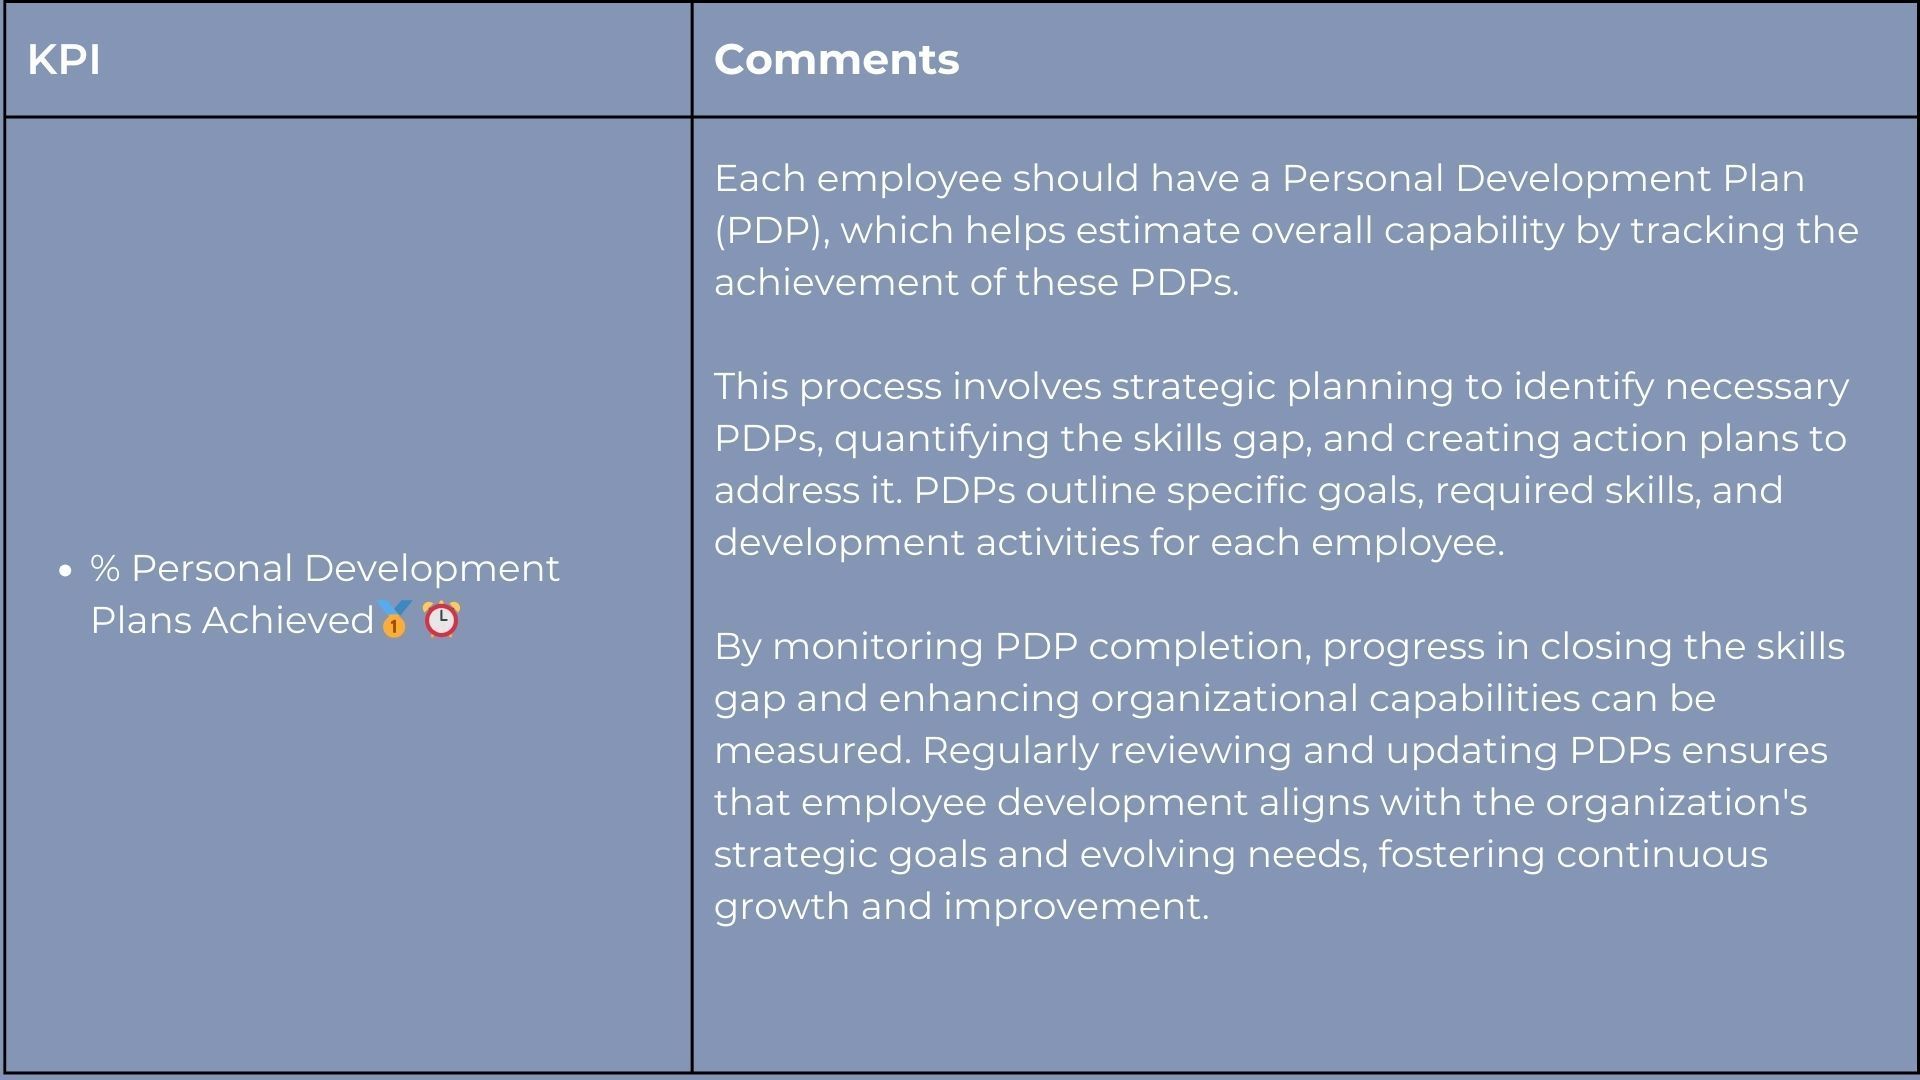
Ideal
Conclusion
Just as a football team needs a balanced approach, focusing on both offence and defence, attracting and retaining talent, and building a loyal fan base, businesses must monitor these six Key Performance Areas to navigate their way to success.
Each KPI represents a critical piece of the game, and mastering them can help any business, regardless of the industry, not just play the game but win it. So, lace up your boots, set your sights on these metrics, and prepare to take your business to the championship and enhance your overall performance.

