Procurement Dashboard
Roger Knocker • November 29, 2023
Procurement Dashboard
Most of the cost in your business comes through the procurement gateway. This is a key area to save cash. We’ve seen how a customer saved up to 20% of the annual net profit just by picking on the right costs to focus on in the procurement process.
The Procurement dashboard deals with managing the purchasing of goods and raw material in a business from the time the need is identified, to when the goods and services are received. Most of the data can be sourced from a standard Procurement or Accounts Payable module in your accounting or ERP system. It covers the processes of:
The key dimensions used in this dashboard are:
Scope
The Procurement dashboard deals with managing the purchasing of goods and raw material in a business from the time the need is identified, to when the goods and services are received. Most of the data can be sourced from a standard Procurement or Accounts Payable module in your accounting or ERP system. It covers the processes of:
- Sourcing
- Requesting / Requisitioning
- Ordering
- Receiving and Returns
- Expediting
- Authorising Invoices
- Payment
The key dimensions used in this dashboard are:
- Supplier
- Cost Centre
- Item
- Type of Cost (Inventory/ Non Inventory)
- Responsible person
- Region
- Document Type
- Process Status
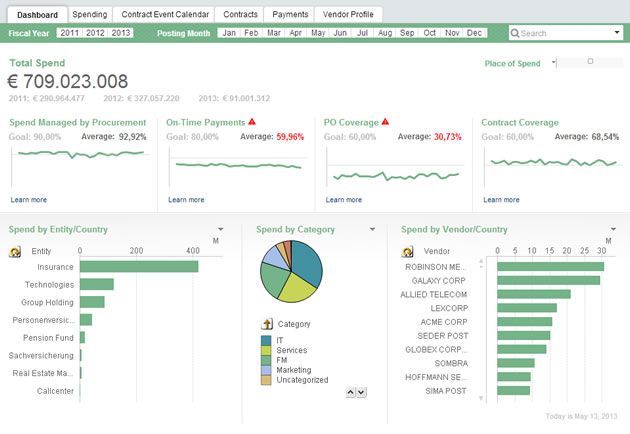
Spend Analysis
Spend analysis will allow you to quickly see what costs are coming into your organisation by some key dimensions:
The key metrics are :
- Value of Spend
- Value of Stock Spend
- Value of non-Stock Spend
- % BEE Spend
Supplier Performance
Poor performance in terms of quality and delivery can have huge downstream implications on your supply chain and ultimately your own business results. Poor supplier performance often leads to holding more inventory to buffer against higher levels of uncertainty. In addition, expediting or alternate supply costs can be significant.
The key metrics we provide are :
- % and # of Returns
- Value of Returns
- % and # of Defects Identified in QA
- Value of Stock Item Spend
- Value of non-Stock Item Spend
- % and # of On Time deliveries
- % and # of In Full deliveries
- % and # of On Time and in Full
- Average order Lead Time
- Average batch size
Negotiated Savings
Many times what is negotiated is not necessarily realised during the normal course of business for one or more of the following reasons:
- Agreed prices are not loaded onto the system
- The supplier supplies an alternate item that wasn’t on the Item master
- The supplier doesn’t update their prices list and this goes undetected
- What happens in practise in different to the contractual agreements
The key metrics we provide are :
- Actual Unit Price
- Negotiated Unit Price
- Variance between Actual and Negotiated Value
- % Price Increase/Decrease
- % Contract adherence
Lost Discounts
The dashboard tracks the value and percentage of discounts that could have been realised if the invoices were paid on time. Paying suppliers late often penalises you more as the early settlement discount is worth more than the interest you earn on that cash.
The key metrics we provide are :
- Actual Discount Realised
- Available Discount
- Variance between Actual and Available
- % Lost Discount
- Value of Lost Discount
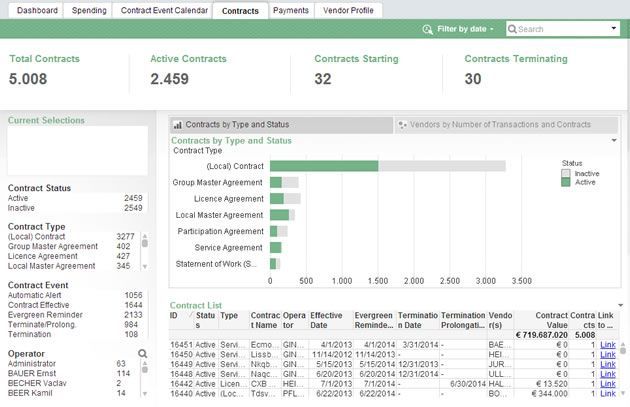
Procurement Processing
Processing procurement transactions can be costly, inefficient and highly frustrating for staff who need goods and services from suppliers to deliver value to their customers. This is because:
- The process is manual
- Workflow processes get stuck with managers who are out of the office or just don’t round to approving purchase orders
- Inaccurate data results in unnecessary rework and delays in the process.
This section of the dashboard identifies the issues, lead times and bottlenecks.
The key metrics we provide are :
- Average Lead time to approve
- Average time from Requisition to Goods Received
- Average days to approve payment
- # of Reworks
- # of Expired Purchase Orders
- % of Orders bypassing the process
- # of Expedited Orders
- # of Order Received not Invoiced
- % of Late Payment

What one construction disaster taught us about process and why every business needs a CAiSY blueprint.
In the world of finance, numbers tell a story. However, that story is often buried beneath layers of spreadsheets and complex datasets. For financial professionals, the challenge is not just about understanding these numbers but also presenting them in a way that drives decision-making and inspires action. Enter data visualisation – the art of transforming data into clear, compelling visuals. Among the tools that have proven especially powerful are the line graph and the waterfall chart. These visuals help finance teams translate dry statistics into impactful narratives. In this article, we explore how these graphs can transform financial storytelling. The Importance of Data Visualisation in Finance Finance professionals are accustomed to handling vast amounts of data, from profit margins and revenue growth to expense tracking and risk assessments. Yet, presenting these figures effectively to stakeholders is a different ballgame. Visualisation simplifies this process, turning complex data sets into accessible insights. When done correctly, data visualisation: Enhances comprehension: Humans process visuals 60,000 times faster than text, making it easier for stakeholders to grasp key information quickly. Drives decision-making: Clear and compelling visuals help executives make informed decisions without wading through dense reports. Highlights trends and outliers: Visual tools can bring hidden trends and anomalies to light, prompting timely actions. Improves understanding and communication with business - Business doesn't always get what Finance is trying to communicate and good visualisations go a long way to bridging the gap. Better communication improves alignment to strategic financial goals. The line Graph: Unravelling Trends Over Time The line graph, also known as a stream graph or a stacked area graph, is a powerful tool for visualising changes in data over time. It is especially effective in showing how multiple categories contribute to an overall trend. In finance, line graphs can illustrate revenue streams, expense categories, or investment performance in a visually engaging manner. Use Case: Revenue Streams Analysis Imagine a financial report for a company with diverse revenue streams, such as product sales, services, and subscriptions. A line graph can display how each stream has evolved, highlighting peaks and troughs. The thickness of each ‘line’ represents the contribution of that revenue stream to the total, making it easy to spot which areas drive growth. Benefits of line Graphs: Trends Made Simple: Displays how multiple components evolve over time. Visual Impact: The fluid, organic design makes it easier to follow changes. Comparative Insight: Helps compare different categories intuitively. The Waterfall Chart: Bridging the Gap Between Figures Waterfall charts excel at breaking down the cumulative effect of sequential data points, making them ideal for financial analysis. They help bridge the gap between figures by showing how individual elements contribute to a total. Commonly used in profit and loss statements, budget analysis, and variance reports, these charts provide clarity in understanding how specific actions impact the bottom line. Use Case: Profit and Loss Analysis A financial analyst preparing a quarterly report might use a waterfall chart to demonstrate how various factors—like increased sales, higher marketing spend, and cost savings—impacted net profit. The chart’s structure, with its clear progression from starting figures to the final result, makes it easy for stakeholders to follow the financial narrative. Benefits of Waterfall Charts: Clarity: Simplifies complex financial data by showing individual contributions to total figures. Transparency: Clearly distinguishes between positive and negative impacts. Decision Support: Helps executives understand the key drivers of financial performance. Choosing the Right Visual for the Right Data Selecting the appropriate visual tool depends on the story you want to tell: Use line graphs for illustrating trends across multiple categories over time. Opt for waterfall charts when you need to detail the step-by-step impact of specific factors on an overall financial figure. By mastering these tools, finance professionals can enhance their storytelling, transforming raw data into insights that drive strategic decisions. Conclusion: From Data to Decisions The ability to visualise data effectively is a powerful advantage. The line graph and waterfall chart are more than just visual aids—they are essential tools for financial professionals looking to make data-driven decisions that resonate with stakeholders. By adopting these techniques, finance teams can turn numbers into narratives that not only inform but also inspire action. In the end, the power of finance lies not just in analysing data but in presenting it with impact.