Correlation between Capability and Performance
Correlation between Capability and Performance
An improvement in capability, will lead to an improvement in performance.
Outputs vs Drivers
In performance management we have the idea of cause and effect. A financial KPI (Profit) is impacted by other KPIs such as Sales Volumes which are themselves impacted by Customer Satisfaction and Process Efficiencies. We also refer to these as outputs and drivers. If we drill down through the organisation we find that the outputs of one process become the drivers of another. A KPI is therefore not necessarily an output or a driver and context becomes important.
As we drill deeper into the process we find that KPIs are either automated or managed by people. When assessing an individual’s performance we use KPIs to quantify their output in terms of:
- Volume
- Quality
- Efficiency
- Cost per Unit
- Number of units produced per hour/day/month
The drivers of performance are found in the collective term: Capability, which consists of primarily the following:
- Education and Knowledge
- Experience:
- Industry Experience
- Functional Experience
- Level of Experience
- Technical Competencies
- Behavioural Competencies
- Track Record.
These are the people drivers now defined as Key Capability IndicatorsTM or KCIsTM. Capability is a weighted sum of these individual KCIs.
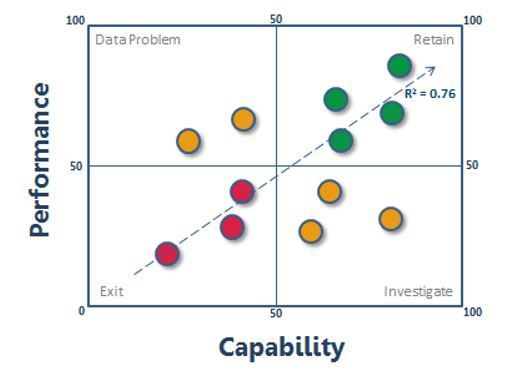
Figure 1 shows the performance of individuals against their capability. We expect to find a correlation between capability and performance. This assumes that we understand and can define the right KCIsTM that predict performance. The major weakness of people management practices in many organisations is that the decision making is based on:
- Performance in the current role that doesn’t predict performance in a future role
- Mistaking terms like ‘good’, ‘experienced’ and ‘qualified’ as proxies for performance
- Management/HR’s subjective, opinion based ratings for people made worse by personal relationships, bias, poorly defined KPIs and incomplete data
To reduce and ultimately eliminate this weakness, organisations should iterate their understanding, definitions, data collection and analysis until a significant R2 indicates that the strength of the correlation is closer to 1. Then people decisions can be made on the basis of more objective data vs subjective opinions.
Managers quite easily rank their people from ‘best’ to ‘worst’ but tend to be quite vague about their preferred employee strategies. The chart above provides a simple and effective basis upon which to develop specific and relevant people strategies.
The Retain Quadrant – Capable Performers
This is the simplest quadrant to understand but many organisations have vague strategies to retain their best people and provide them with a set of reasons that make staying and growing with the organisation a compelling proposition.
Retention strategies include the basic levers: remuneration, promotion, conditions of work, educational options and perks. Less obvious levers include customised career development with a 5 year view, integration with personal and family goals and aspirations incl. customised perks, work life balance, membership to elite groups of employees with access to higher level decision makers, development opportunities and exposure to best practices, top external consultants, career coaching etc
Exit Quadrant – Less Capable Non-Performers
A lack of objective decision making and data allows people to gain access to jobs in which they are less likely to perform. The data in this quadrant confirms this to be the case and the managers are faced with one of three decisions:
- Develop their capabilities in the hope that performance will follow. This is likely to be a weak option (See sidebar: Losing a good person for the wrong reasons)
- Transfer them to a more suitable role. A better option if the manager understands objectively what’s ‘wrong’ with the person in the current role and why they will suit the next role. Again, it takes data and iteration to understand the capability levers of performance.
- Exit them: This decision is often passive. When the employee feels the heat from a manager starting to performance manage, they may resign. But the manager hasn’t necessarily learned the lesson of who not to hire in the future. The whole point of this quadrant is to avoid making the same mistakes again. Only good data and iterated KCITM definitions will assist. In many organisations, it’s potluck. Investigate Quadrant – Capable Under Performers
When a capable person is selected and fails to perform, HR needs to intervene soon as the problem may be the boss himself. People like or don’t like each other for many reasons. So too, do employees not like their bosses. The difficulty is that bosses hols many of the cards and if they have built a culture of fear, it’s likely that the failing but capable employee will leave and again, the organisation learns nothing. In this event, HR should explore the issue to see what’s happening:
- Does the employee have the right credentials on paper, but no experience?
- Did the employee make a big impression during the selection process which didn’t convert into performance after the job was secured? Why?
- Is the manager able to inspire and motivate the individual or does it look like relations are strained?
- Are there issues in the environment handicapping the individual such as unreliable equipment, insufficient training, poor working processes, difficult or unhelpful colleagues or poor management (see side bar – Capable Under Performer or Bad Boss?)
- Were the Capability and Performance criteria correctly defined? Are we measuring the right things?
- Are colleagues failing to deliver their roles and is this person is being unfairly judged as a result?
Data Problem Quadrant – Less Capable Performers
This can be seen as an unexpected but welcome problem. But it indicates that our assessment of capability or performance is inaccurate. The whole point of the capability vs performance correlation method is to predict performance based on a measurement of capability to enhance the effective management of capable performers. Like the Investigate Quadrant, we need to analyse the definitions and data to find better correlations.
Factors to check:
- The role specification is too high for what is really required. It’s common for people to overestimate the academic and experience qualifications for a role. For example: sales roles. Managers may feel that a degree will support better performance or be an indicator of a better candidate. In fact, this can be an expensive and incorrect assumption. See side bar: Fit for Purpose.
- The honeymoon effect: When people start a new job, they will typically be on best behaviour. Even if they don’t like the job or are unsuitable, they will try harder and, for a time, produce better results. The data surrounding newer staff should be treated as a work in progress until longer average tenures are reached and performance levels are stable.
- Hidden factors: Sometimes the data isn’t representative. When a manager or colleague helps a less capable subordinate or colleague respectively, the higher performance level is superficial. If HR doesn’t understand this or doesn’t have the data, they may change the recruitment spec on the evidence of incorrect data. If management is complicit (‘we are a team’), then the data on the Correlation Chart is likely to be less useful in understanding the true picture.
It all comes back to defining the right capability and performance measures and constructing objective data.
The correlation process unearths the truth, removes subjectivity of any sort (e.g. favouritism, blind spots) and eventually reaches a point that HR and management understand the real capability drivers of performance.
Strategic Insights
By simply separating Capability from Performance, we produce valuable data that helps management ask very strategic and insightful questions:
- What are the capabilities I need to assess in my people and in new recruits before I can expect consistent and predictable performance? (See sidebar – Finding the key levers)
- On which capabilities should I focus the most resources?
- Do we have the right people in the right jobs?
- Have we over specified the job requirements?
- Are we paying too much for highly capable people in roles that don’t require such a high calibre of candidate?
- What have we learnt that can be applied to the training strategy?
- Can we recruit more effectively?
- Who is not going make it and how can we exit or transfer them constructively?
- Are there environmental issues for which we need to take corrective action?
- Do we have the right and accurate data? In many cases, managers know what they want, but they don’t know how to measure it accurately and so resort to subjective opinions on 5 point scales. This leads to a massively skewed distribution curve of data around 3 out of 5 with almost no data at 1 or 5. This invariably leads management and employees to treat staff assessments and surveys as compulsory and irritating tick box routines, once or twice a year.

